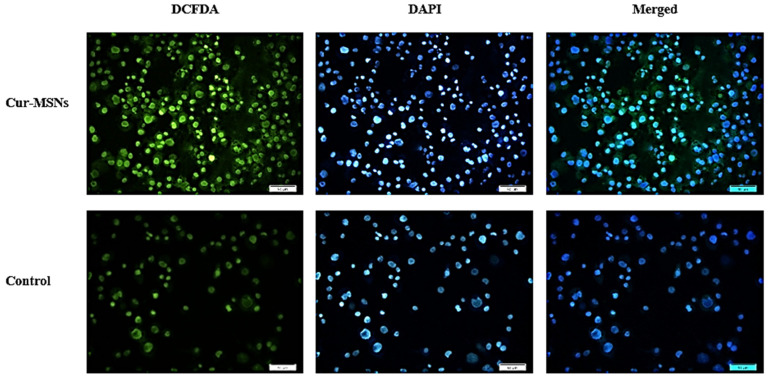
Figure 6.
In HN5 cells exposed to Cur-MSNs and control cells (untreated HN5 cells), the ROS production was measured by staining HN5 cells with DCFDA that shows green fluorescence, as well as Nuclei, which were stained with DAPI (blue) with 200× microscopic magnification. Cur-MSNs induced ROS accumulation in HN5 cells.

