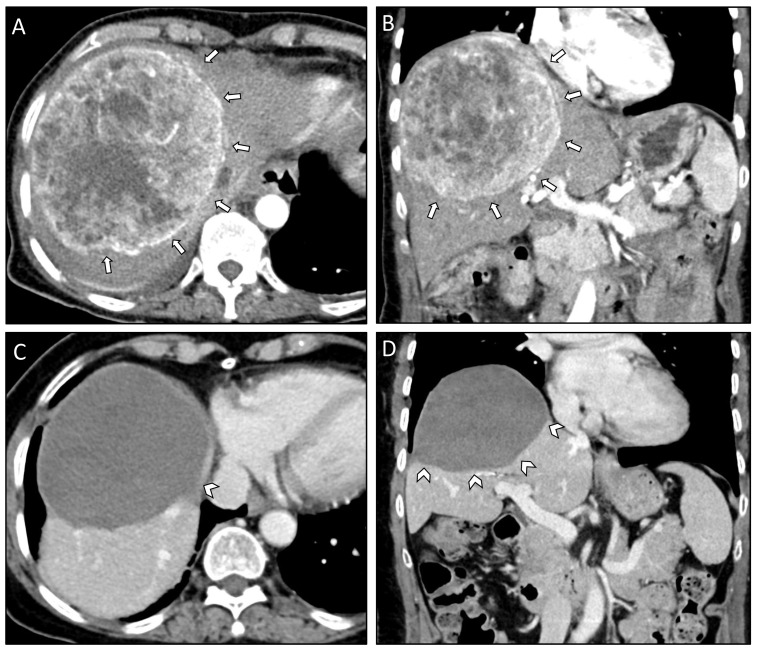
Figure 1.
Axial (A) and coronal plane (B) of the pre-interventional CT scan of case #1 depicting a 13 cm measuring SFT/HPC in the right liver lobe (white arrows). Corresponding axial (C) and coronal plane (D) of the last follow-up CT scan 36 months after the initial diagnosis of liver metastasis and 11 months after the last SRFA session with progressively shrinking coagulation zone (white arrowheads).

