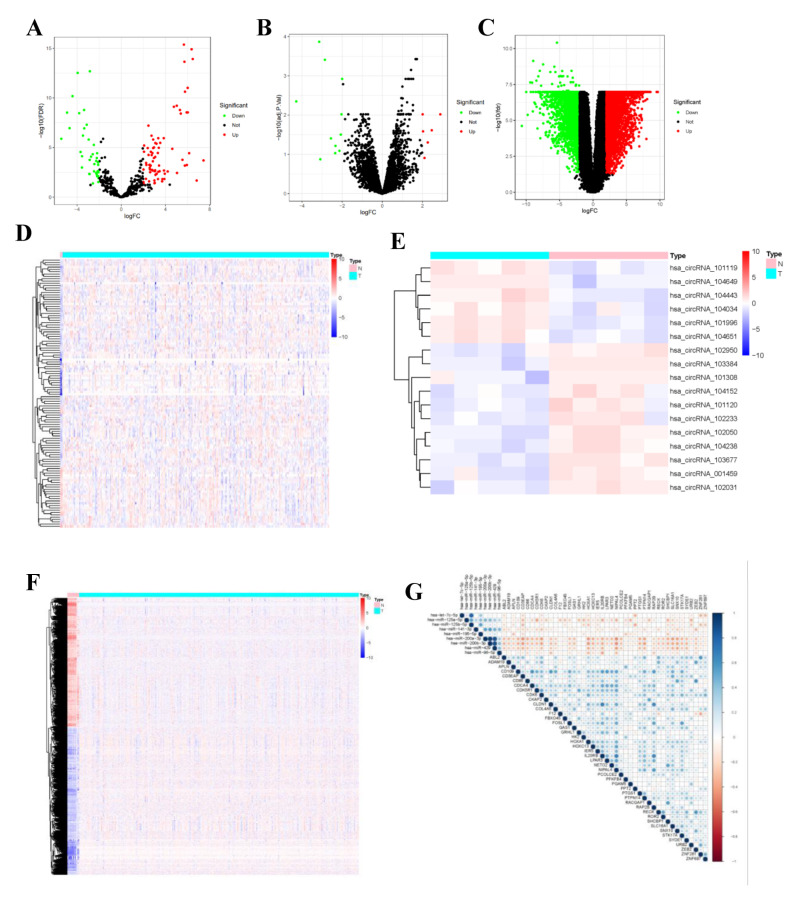
Figure 2.
Identified DEcircRNAs, DEmiRNAs, and DEmRNAs. Provided are the volcano plot (A) and the heatmap (B) of 118 differentially expressed miRNAs between the two groups; the volcano plot (C) and the heatmap (D) of 7 differentially expressed cirRNAs between the two groups; and the volcano plot (E) and the heatmap (F) of 6136 differentially expressed protein-coding genes between the two groups; All differentially expressed genes had a log (fold-change) > 2.0 or <−2.0 and the overall of FDR < 0.05. Red represents upregulate and green represent downregulate. The change in color represents the difference in expression. DE, differentially expressed. The heat map showing the correlations of the circRNA-miRNA (G), with blue representing positive correlations, red representing negative correlations.

