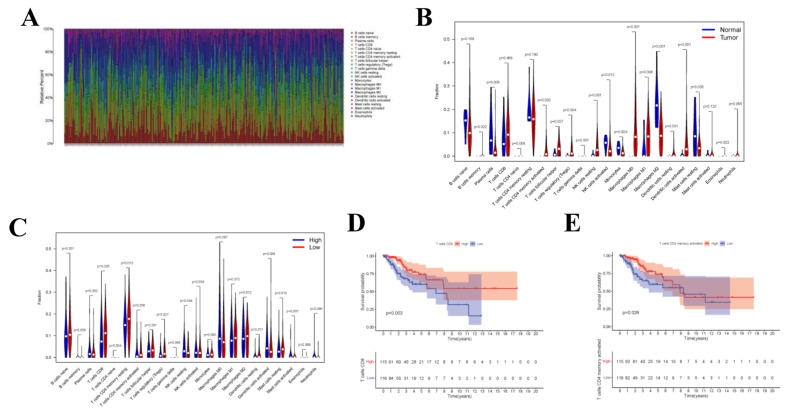
Figure 8.
CIBERSORT Estimation and Survival Analysis. The composition (A) of immune cells estimated by the CIBERSORT algorithm in 13 normal adjacent tissues and 304 CESC tissues. The violin plot of immune cells (B) compares cells’ proportion between the two groups. The violin plot of immune cells (C) compares cells’ proportion between the gene high-risk and low-risk groups. (D,E) The K–M survival curves of immune cells, where showed genes significantly correlated with prognosis (p < 0.05).

