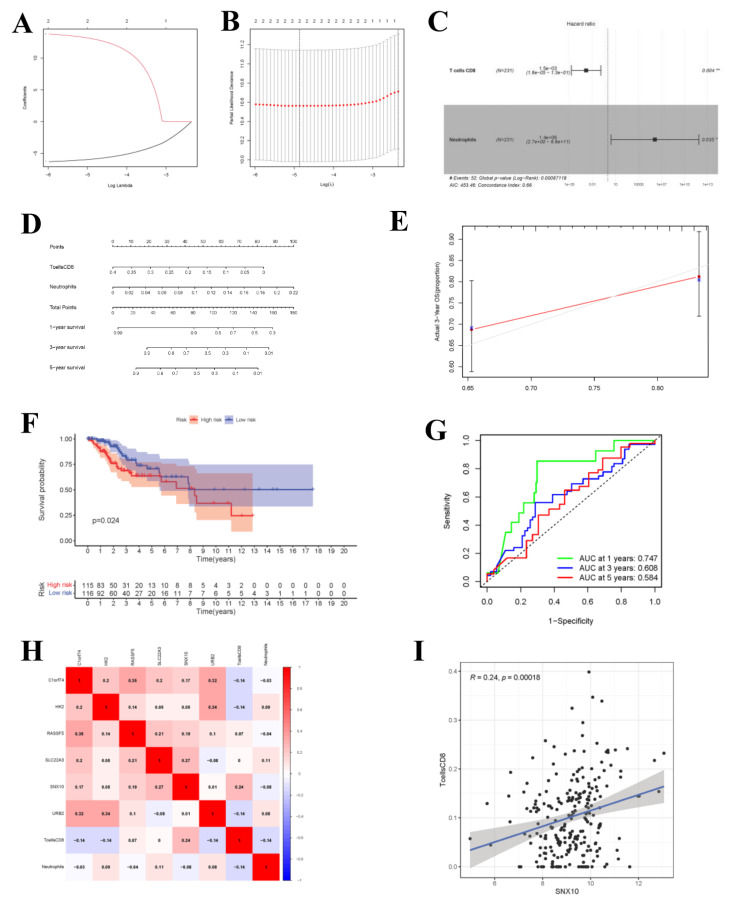
Figure 9.
Cox Proportional Hazards Regression Model and Co-expression Analysis. (A,B) The results of lasso regression analysis results. (C) Forest plot shows prognostic circ-related mRNA signatures of CC. T cells CD8 and Neutrophils were integrated into the Cox proportional hazards regression model (* p < 0.05; ** p < 0.01). The nomogram (D) was constructed based on the model. The ROC (G) and calibration curves (E) indicate the acceptable accuracy (AUCs of 1-year survivals: 0.747) and discrimination of the nomogram. (F) OS of patients with high/low-risk score. (H) The co-expression heatmap of the RNAs and immune cells in the two Cox proportional hazards regression models; the significant results of Pearson correlation coefficients between the RNAs and immune cells: T cells CD8 and SNX10 (I).

