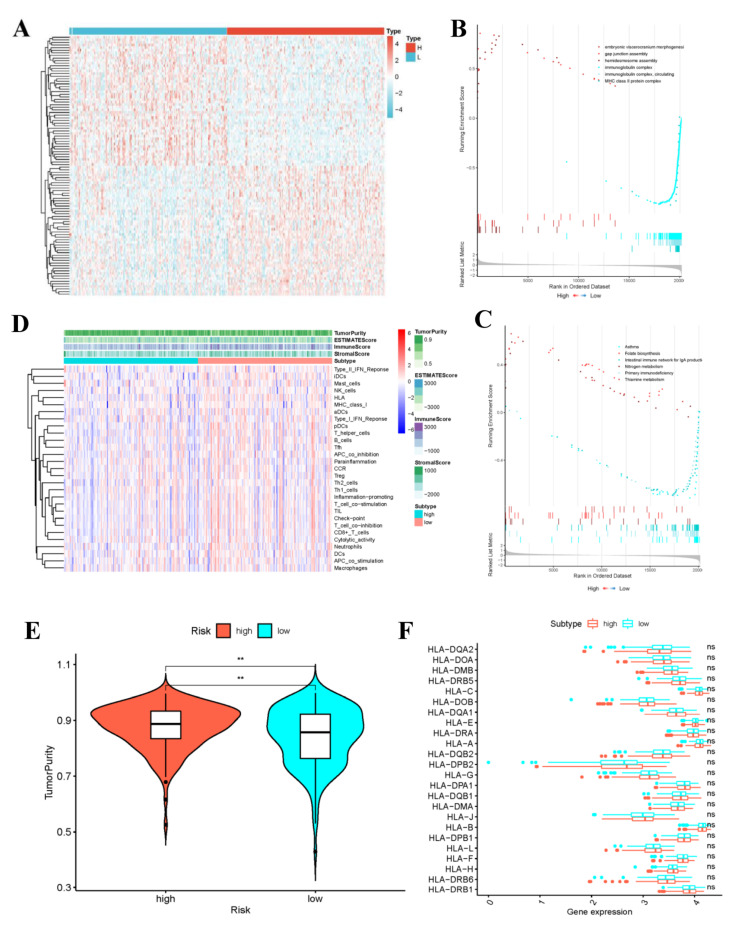
Figure 10.
Gene set enrichment analysis and the low-risk and high-risk samples show different tumor purity. (A) Differential Analysis Heatmap. (B) Plot of GO enrichment results. (C) Plot of KEGG enrichment results. The immune status (D), tumor purity (E) and the distribution of HLA related genes (** p-value < 0.01) (F) of the low-risk and high-risk samples.

