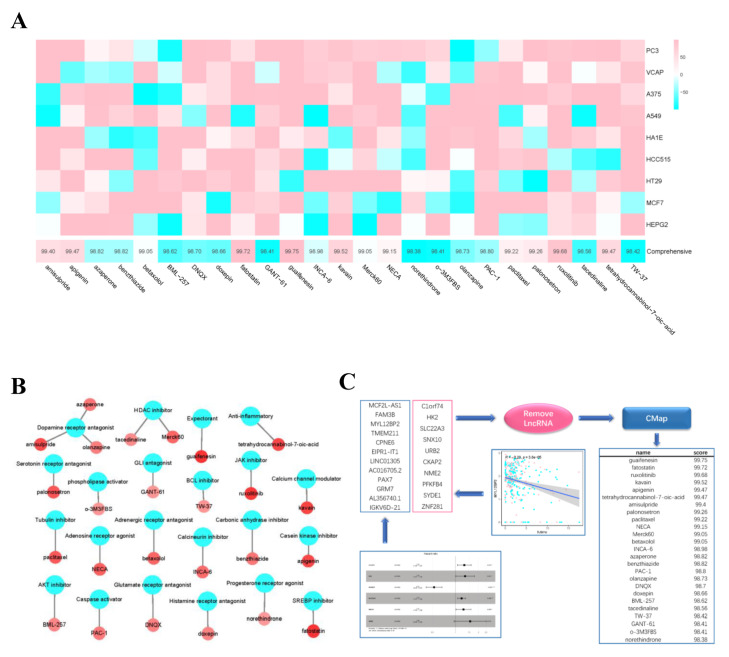
Figure 12.
Drug prediction. (A) the abscissa of the heatmap is the compound and score, the ordinate is the cell line, red indicates sensitivity to the compound, and blue indicates insensitivity to the compound. (B) Network diagram shows compounds and their functional classification. (C) The gene set consists of two parts, one is the genes filtered by univariate Cox analysis and lasso regression analysis, and the other is the genes that are significantly different between high- and low- risk groups and negatively correlated with survival time. CMap analysis are performed after removal of non-coding RNA, then obtain the top 25 drugs (* p < 0.05; ** p < 0.01; *** p < 0.001).

