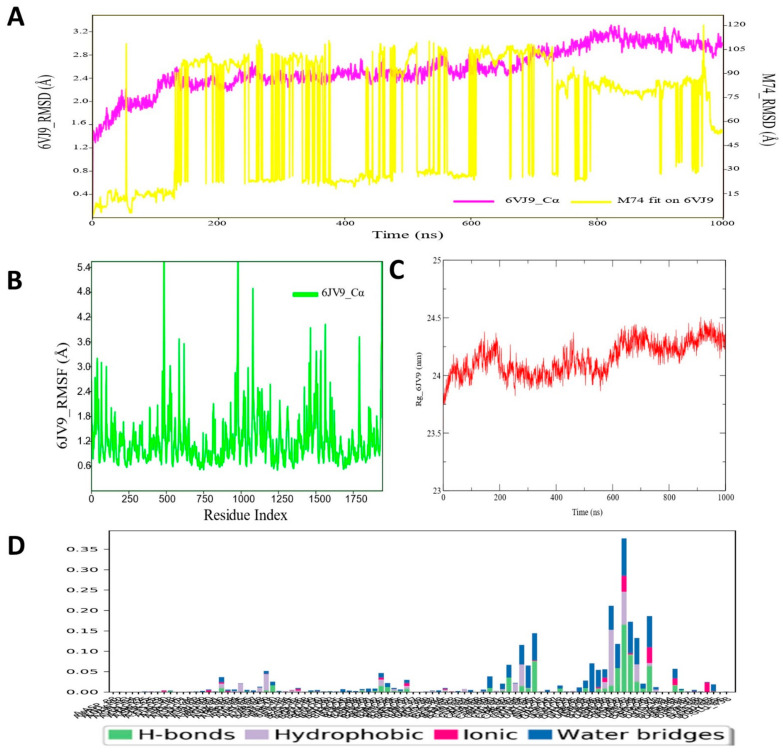
Figure 3.
(A) RMSD profile of CRMP2 (6JV9) protein backbone and compound M74 during 1000 ns simulation span; (B) RMSF profile of CRMP2 (6JV9) protein backbone during 1000 ns simulation span; (C) RoG profile of CRMP2 (6JV9) protein backbone during 1000 ns simulation span; (D) illustration of the CRMP2 (6JV9)–M74 contacts or interactions map monitored during 1000 ns simulation run.

