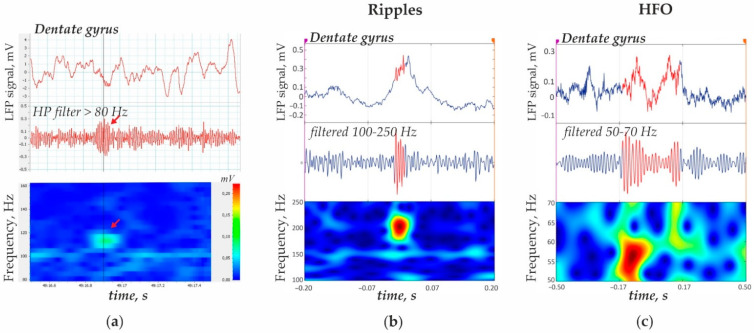
Figure 1.
Representative hippocampal ripples and 50–70 Hz high frequency oscillations (HFO) in time and frequency domains. (a) Ripple oscillation in the dentate gyrus LPF could be visualized in the filtered signal and in the time-frequency plot (red arrow). The amplitude spectrum was plotted with a fast Fourier transform (length 512, window overlap 93.75%). (b) Ripple oscillation detected by means in RIPPLELAB. (c) High frequency oscillation 50–70 Hz (HFO) detected by means of RIPPLELAB.

