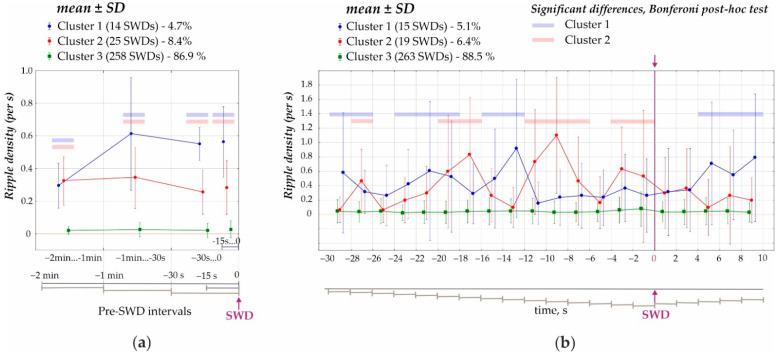
Figure 3.
Density of hippocampal ripples before and during SWD. (a) Ripple density during the 120 s preictal period divided into three statistically different clusters. Blue and rose stripes highlight significant differences of Cluster 1 (4.7% from all SWDs, shown in blue) and Cluster 2 (8.4%, shown in rose) from Cluster 3 (86.9%, shown in green, all p’s < 0.0001, Bonferroni tests. (b) Ripple density during a 40 s period around the onset of SWDs divided into three statistically different clusters. Blue and rose stripes mark significant differences between Cluster 3 and Cluster 1 (blue) & Cluster 3 and Cluster 2 (rose) (all p’s <0.05 Bonferroni tests).

