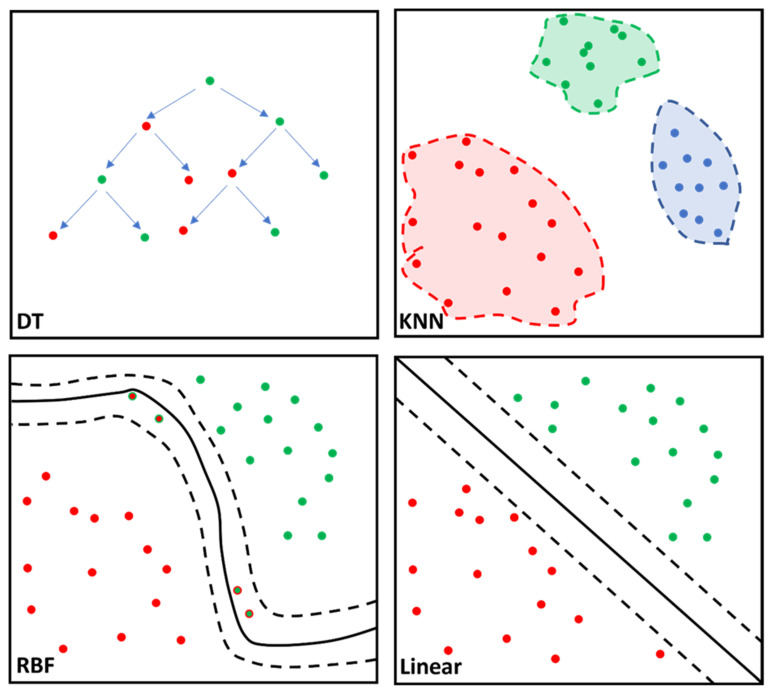
Figure 2.
Simplified illustration of the classifier algorithm function for the decision tree (DT), k-nearest neighbor (KNN), support vector machine (SVM), radial basis function (RBF) kernel and SVM linear are portrayed. DT is characterized by the nodes (dots) representing variables and the branches (arrows) representing decisions. KNN calculates data proximity (Euclidian distance) by assuming similar variables remain at a shorter distance from one another. RBF computes similarity between two data points ranging from 0 (similar) to 1 (dissimilar) enabling complex separation between data points. SVM linear separates the data points based on the linear dividing “hyperplane”, albeit with less flexibility than SVM RBF kernel. Different colored dots represent different cohorts; solid line corresponds to best separation of cohorts; dashed lines represent confidence intervals.

