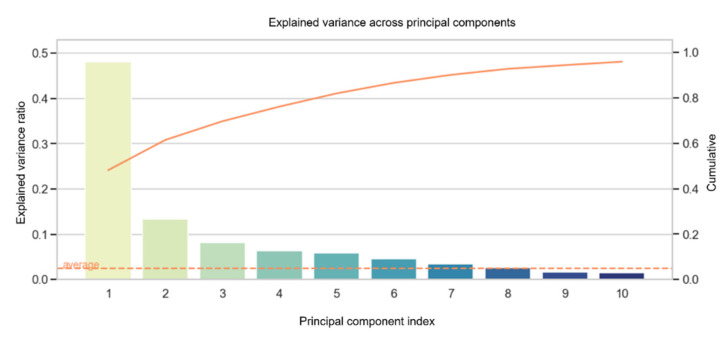
Figure 5.
The explained variance of the 10 most valuable diagnostic features is given in descending order from left to right. The PCA bars each represent one component. For example, the first bar of the explained variance is composed of the following variables shown in Table 2. Solid line corresponds to the cumulatively explain of the data. LV-EF = left ventricular ejection fraction, RV-EF = right ventricular ejection fraction, RA = right atrial, LA = left atrial, RV = right ventricular.

