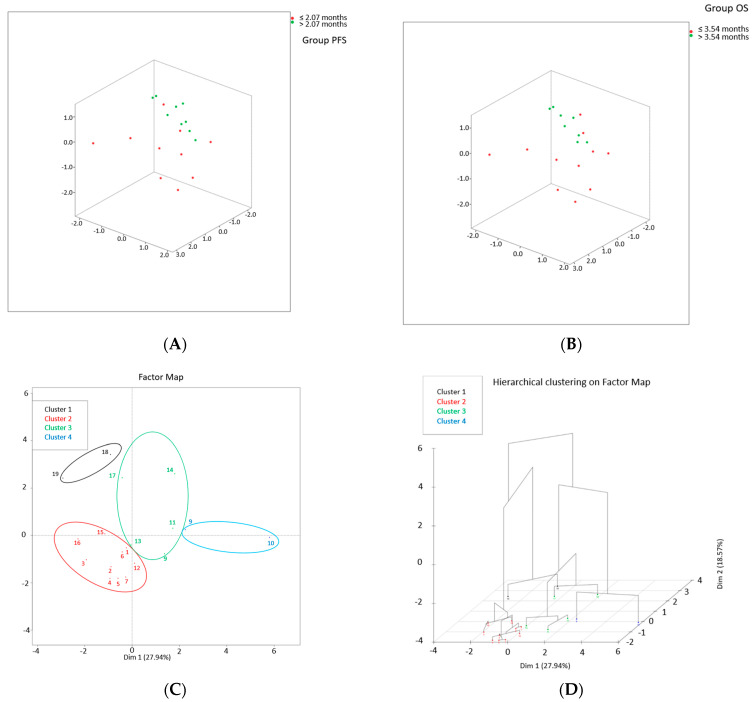
Figure 3.
Cluster analysis. (A) Tridimensional PCA plot [pts with PFS <= median (red); pts with PFS > median (green)]. (B) Tridimensional PCA plot [pts with OS <= median (red); pts with OS > median (green)]. (C) Factor map of K-means cluster and (D) HCPC 3D dendrogram showing the 4 clusters of pts (cluster 1: black; cluster 2: red; cluster 3: green; cluster 4: blue).

