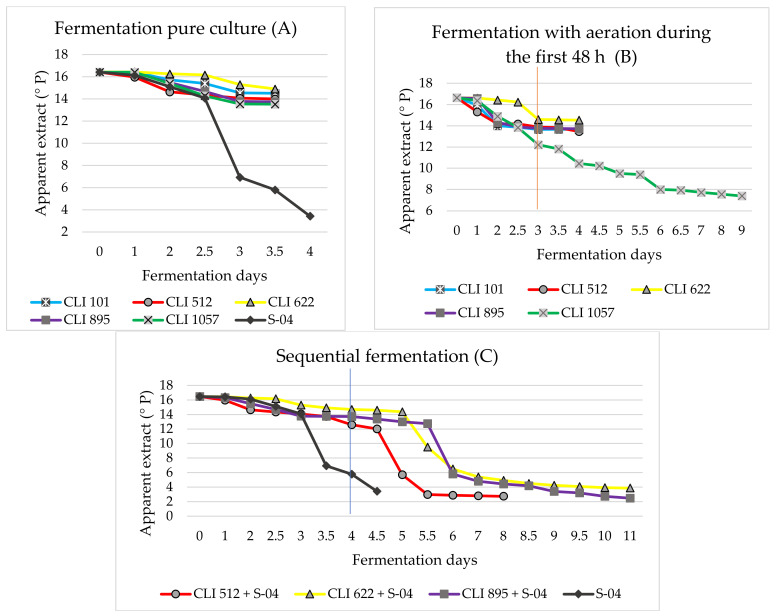
Figure 1.
Fermentation kinetics for the different experiments: pure culture (A), fermentation with aeration during the first 48 h (B), and sequential fermentation (C). The vertical line in experiment B indicates the moment in which aeration was stopped, while in experiment C indicates when de S. cerevisiae strain S-04 was added.

