Figure 2.
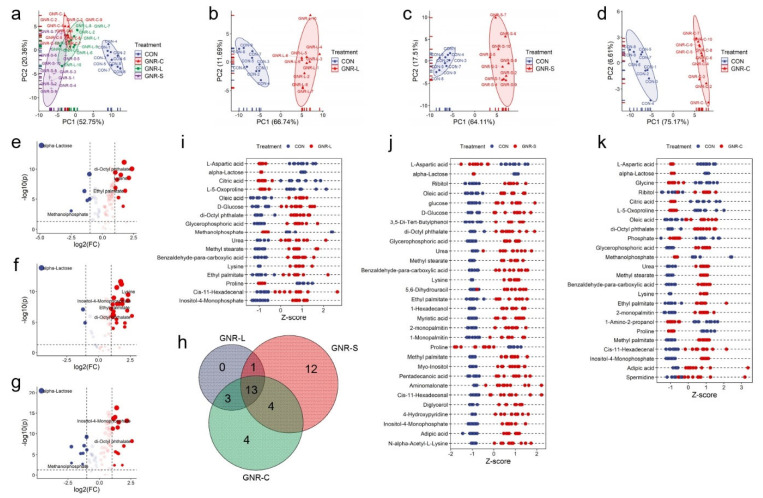
(a) PCA of endo-metabolites of Hep G2 cells treated with different shaped GNRs (GNR-L, GNR-S, and GNR-C). PCA of endo-metabolites of Hep G2 cells treated with (b) GNR-L, (c) GNR-S, and (d) GNR-C for 12 h. Volcano plots of endo-metabolites of Hep G2 cells treated with (e) GNR-L, (f) GNR-S, and (g) GNR-C for 12 h. (h) Venn diagrams of statistically significant changed metabolites of Hep G2 cells treated with GNR-L, GNR-S, and GNR-C. Z-score plot of statistically significant changed metabolites of Hep G2 cells treated with (i) GNR-L, (j) GNR-S, (k) GNR-C. The metabolites were defined as showing statistically significant change if p value was <0.05, and fold change value was >2 or <0.5.

