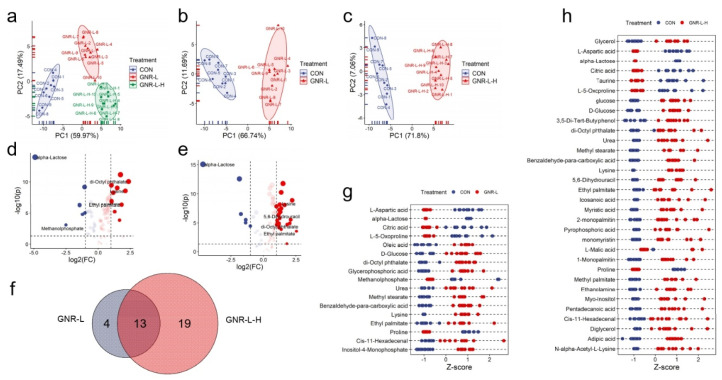
Figure 3.
(a) PCA of endo-metabolites of Hep G2 cells treated with GNR-L of different concentrations (GNR-L, GNR-L-H). PCA of endo-metabolites of Hep G2 cells treated with (b) GNR-L and (c) GNR-L-H for 12 h. Volcano plot of endo-metabolites of Hep G2 cells treated with (d) GNR-L and (e) GNR-L-H. (f) Venn diagram of statistically significant changed metabolites of Hep G2 cells treated with GNR-L and GNR-L-H. Z-score plots of statistically significant changed metabolites of Hep G2 cells treated with (g) GNR-L and (h) GNR-L-H. The statistically significant changed metabolites were considered significant if p value was <0.05 and fold change value was >2 or <0.5.

