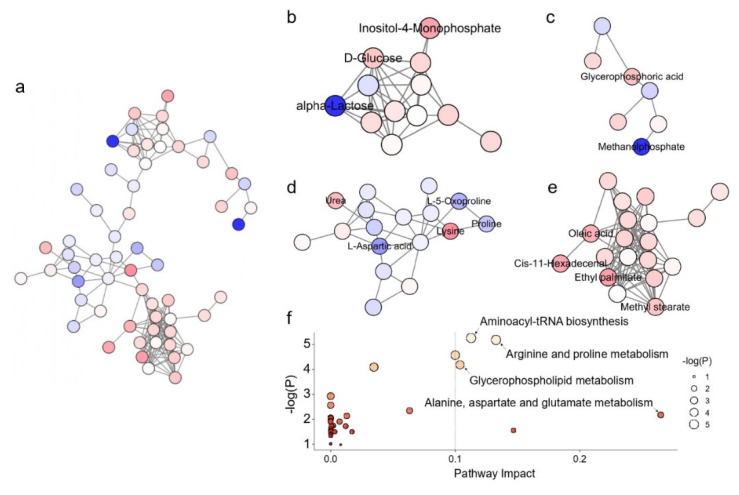
Figure 5.
Metabolic network analysis of Hep G2 cells treated with GNR-L for 12 h: (a) all significant changed metabolites, (b) carbohydrate-related metabolites, (c) phosphorylate-related metabolites, (d) amino acid-related metabolites, (e) fatty acid-related metabolites. (f) Pathway enrichment analysis of significantly changed metabolites. Significantly changed pathways based on enrichment and topology analysis are shown. The x-axis represents pathway enrichment, and the y-axis represents pathway impact. Large sizes and yellow colors represent major pathway enrichment and high pathway impact values, respectively.

