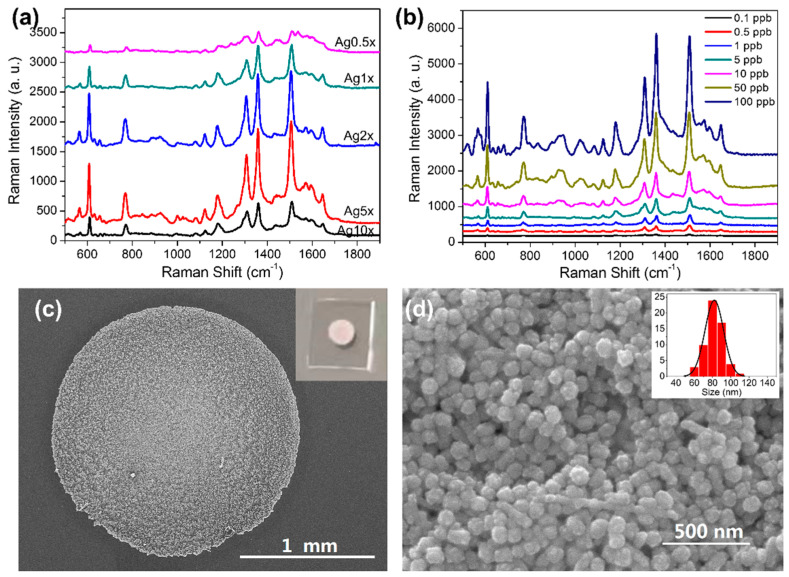
Figure 2.
SERS spectra of R6G on AgNPs-PDMS substrates with various surface densities of AgNPs (a). SERS spectra of R6G (0.1~100 μg L−1) on optimized AgNPs-PDMS substrate (b). SEM images of the optimized AgNPs-PDMS substrate under different scales (c,d). Inset of c: photo of the prepared substrate. Inset of d: statistical analysis of size distribution of the modified AgNPs.

