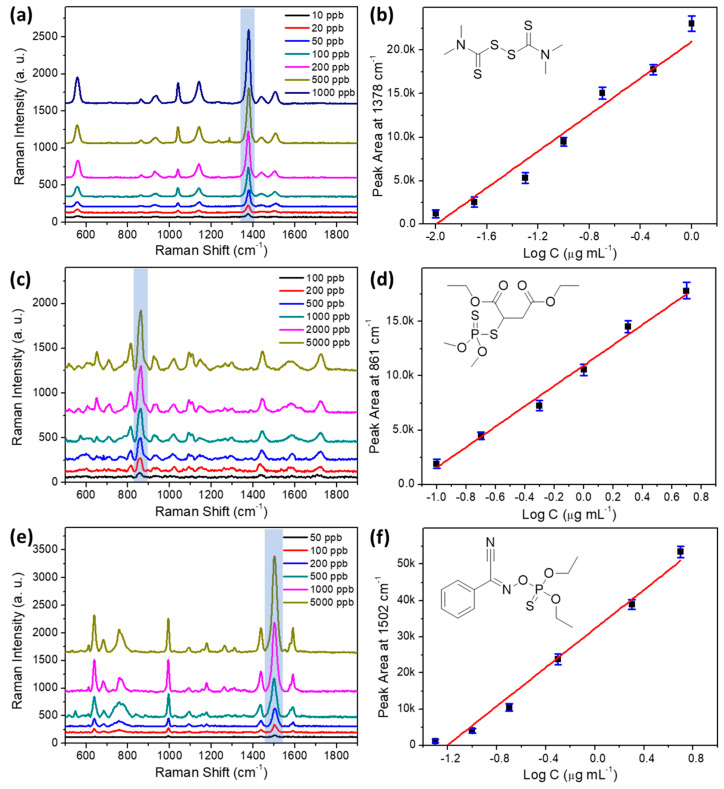
Figure 4.
SERS spectra of different concentrations of thiram (a), malathion (c), and phoxim (e). Linear calibration plots between the integrated peak area and the logarithm of concentration for thiram (b), malathion (d), and phoxim (f). Inset of (b,d,f): molecular structure of thiram, malathion, and phoxim.

