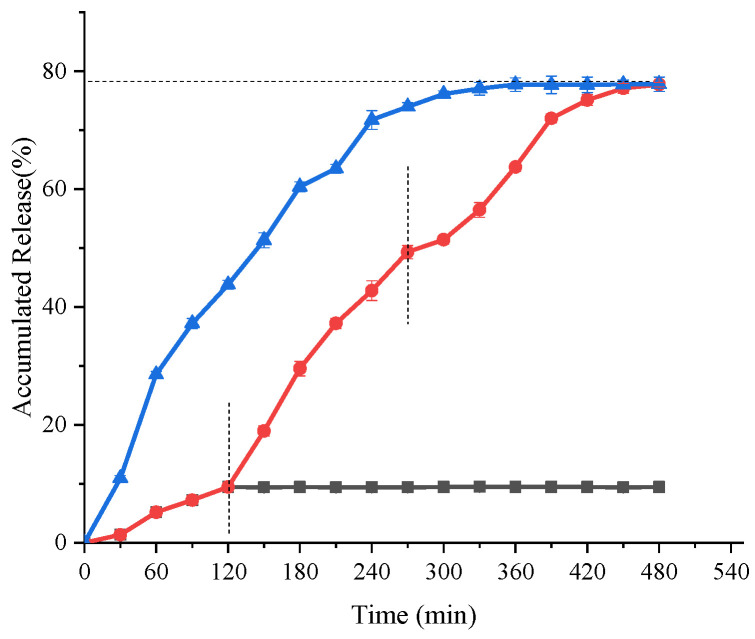
Figure 7.
Releasing properties of saponin in vitro. Black curve shows the variation of saponin release from the composite hydrogel loaded with saponin in simulated gastric fluid (pH 2.0) as a function of time; red curve shows the cumulative release curve for the composite hydrogel samples loaded with saponin; blue curve shows the release of saponin in simulated intestinal fluid (pH 7.5) for the composite hydrogel samples loaded with saponin with time.

