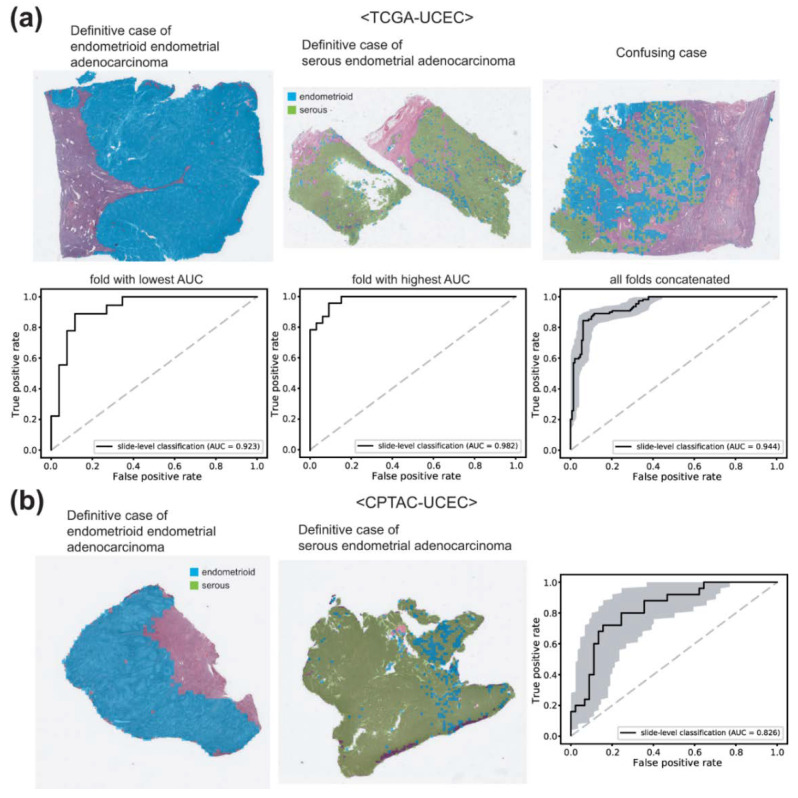
Figure 4.
Classification results for endometrial cancer subtypes. (a) Results for the TCGA-UCEC dataset. Upper panels: the representative whole slide images (WSIs) of clear endometrioid endometrial adenocarcinoma, clear serous endometrial adenocarcinoma, and confusing case with mixed classification results. Lower panels: the receiver operating characteristic (ROC) curves of slide-level classification results for folds with the lowest and highest area under the curve (AUC) and concatenated results of all 5-folds. (b) The classification results of the CPTAC-UCEC dataset by the classifier trained with the TCGA-UCEC dataset. Left two representative WSIs demonstrate clear endometrioid endometrial adenocarcinoma and clear serous endometrial adenocarcinoma. The ROC curve is obtained from all CPTAC-UCEC tissues with more than 30% of tumor tissue regions.

