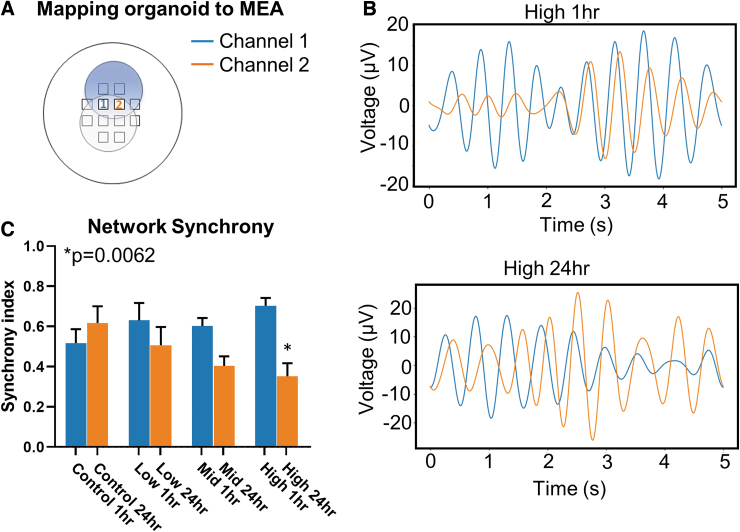
FIG. 4.
High-frequency blast desynchronizes network oscillations in cerebral organoids. (A) Organoids were mapped to multi-electrode array grid to spatially identify channels of interest. For synchrony data, proximal electrodes were selected for active channels to compare synchrony in oscillatory activity. (B) Top, filtered oscillations of paired channels from High 1-h exposure group. Channel 1 is presented in blue, and channel 2 is presented in orange. Bottom, similar oscillations from the same organoid 24 h after exposure. (C) Quantification of network synchrony across all tested pressure wave frequencies. Error bars presented as standard error of the mean. *p < 0.05, n = 12 organoids per group. All statistics calculated using one way analysis of variance. Color image is available online.

