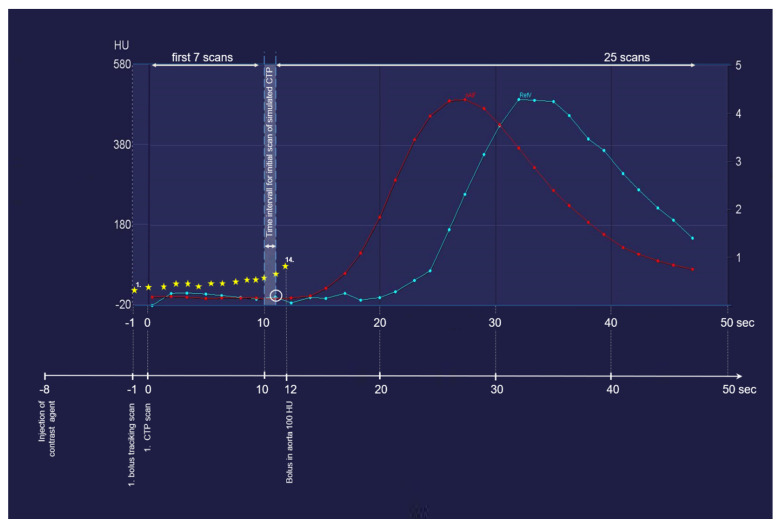
Figure 2.
With the aid of an example, this figure explains the method of identifying the first scan of the simulated data sets. The CT attenuation values of the bolus tracking scan are marked with *. The x axis indicates the time passed after the contrast agent injection. The y axis represents the corresponding attenuation values. In the simulated CTP examinations, the initial scan was set to at least 1 s but not more than 2 s before the time at which the contrast agent bolus approached the threshold value of 100 HU in the ascending aorta. This means that if the contrast agent reached the threshold value (for example, 20 s after injection), the first CTP scan should be chosen around 18 s after injection, corresponding to the 8th scan acquired at 19 s after the contrast agent injection in this case. nAIF: arterial inflow peak; RefV: venous inflow peak.

