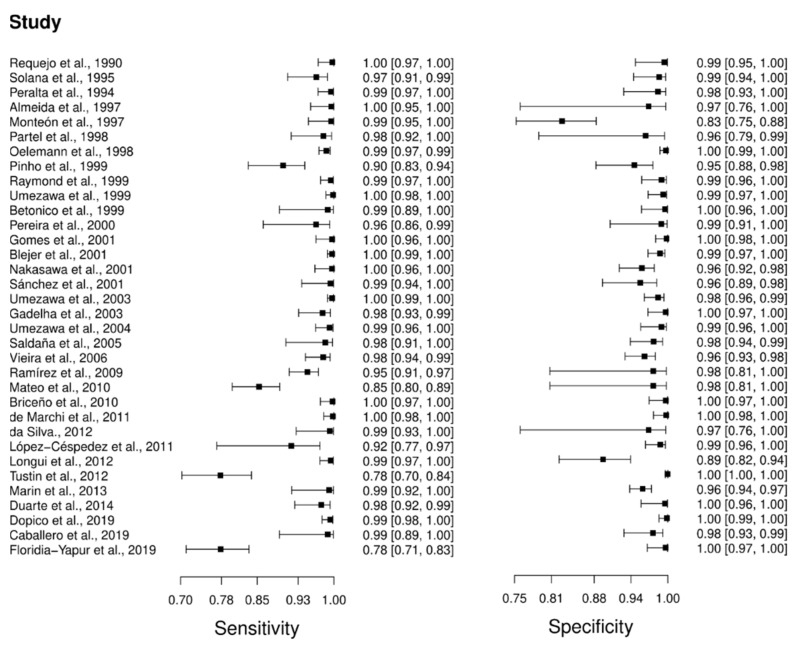
Figure 4.
Study data and paired forest plot of the sensitivity and specificity of Enzyme-linked immunosorbent assay (ELISA) in Chagas’s disease diagnosis. Data from each study are summarized. Sensitivity and specificity are reported with a mean (95% confidence limits). The Forest plot depicts the estimated sensitivity and specificity (black squares) and its 95% confidence limits (horizontal black line) [46,47,48,49,50,51,52,53,54,55,56,57,58,59,60,61,62,63,64,65,66,67,68,69,70,71,72,73,74,75,76,77,78,79].

