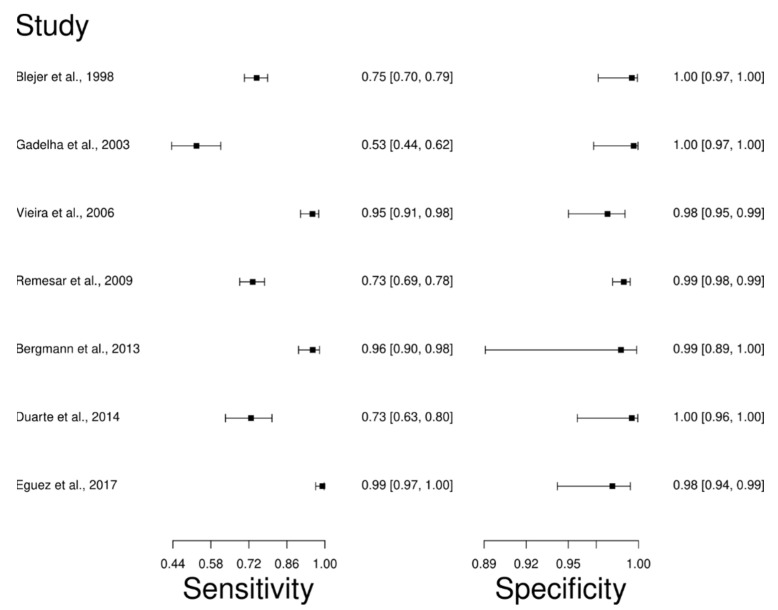
Figure 6.
Study data and paired forest plot of the sensitivity and specificity Hemagglutination test (HmT) in Chagas’s disease diagnosis. Data from each study are summarized. Sensitivity and specificity are reported with a mean (95% confidence limits). The Forest plot depicts the estimated sensitivity and specificity (black squares) and its 95% confidence limits (horizontal black line) [63,66,76,84,85,86,87].

