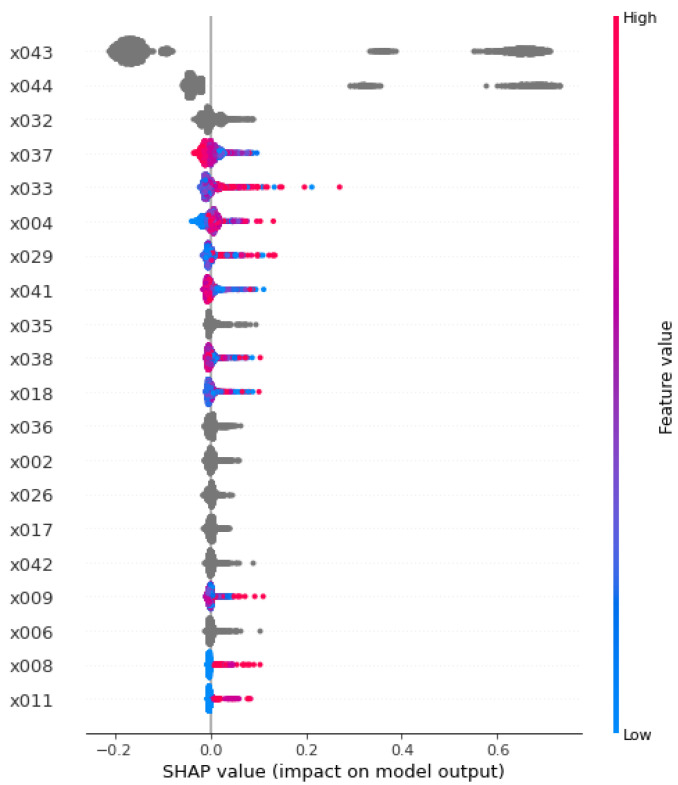
Figure 1.
SHAP summary plot. The SHAP value of a predictor for a participant measures the difference between what machine learning predicts for the probability of GERD with and without the predictor. For example, in this hypothetical figure, the SHAP values of diabetes (x033) for GERD have the range of (−0.05, 0.30). Here, some participants have SHAP values as low as −0.05, and other participants have SHAP values as high as 0.30. The inclusion of a predictor (diabetes) into machine learning will decrease or increase the probability of the dependent variable (GERD) by the range of −0.05 and 0.30. In other words, there exists a positive association between diabetes and GERD in general.

