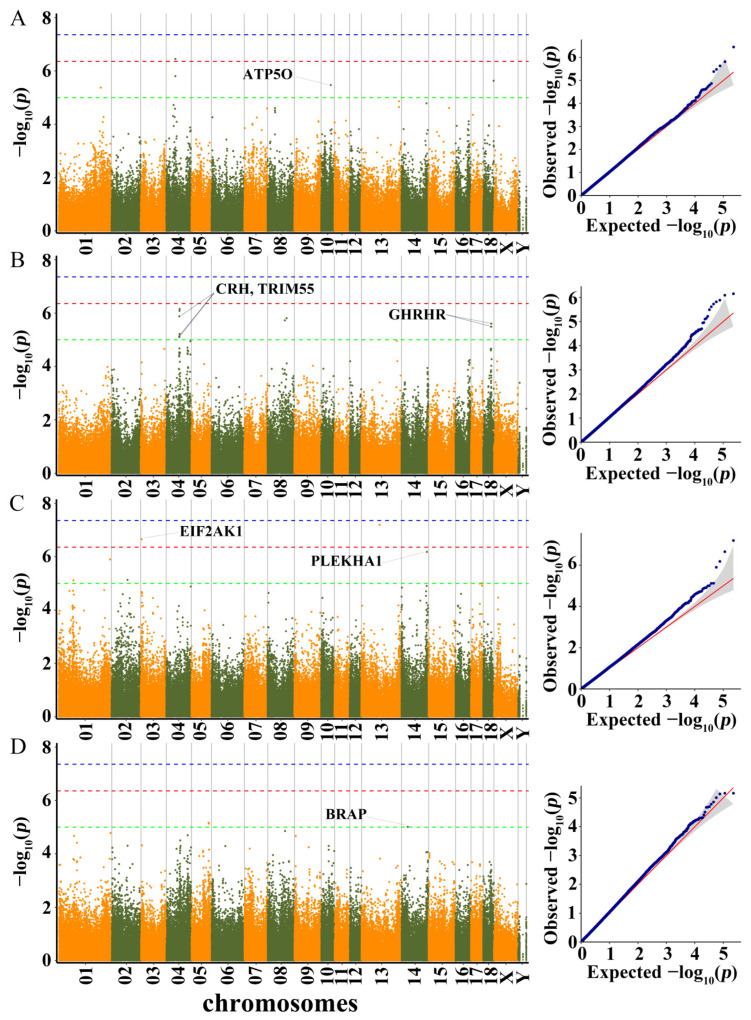
Figure 3.
Manhattan plots and QQ plots for LBT, ADG30–60, ADG60–100, and ADG30–100 using MLM. (A) LBT, (B) ADG30–60, (C) ADG60–100, (D) ADG30–100. Negative log10 p-values of the filtered high-quality SNPs were plotted against their genomic positions. The dashed lines of green, orange and blue correspond to the Bonferroni-corrected thresholds of p = 1.00 × 10⁻⁵ (−log10 p = 5), p = 4.39 × 10⁻⁷ (−log10 p = 6.36) and p = 4.39 × 10⁻⁸ (−log10 p = 7.36), respectively.

