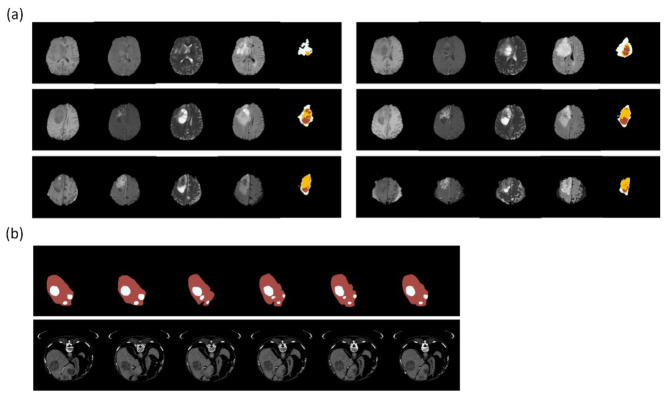
Figure 7.
Clinical dataset for training segmentation model. (a) BraTS is a dataset for glioblastoma multiforme. The figures show part of a case series with different MRI weights (from the left: T1, T1ce, T2, FLAIR) and annotations (rightmost: white—perifocal edema; yellow—tumor; red—necrosis). (b) LiTSis a dataset about liver and liver tumor segmentation. The figures show part of a case series with annotations (upper: red—liver; white—tumor) and CT images (lower). Reference: (a) from BRATS (Menze et al. [25,56,57]); (b) from LiTS (Bilic et al. [58]). The figures were illustrated by using Python 3.6 from the datasets.

