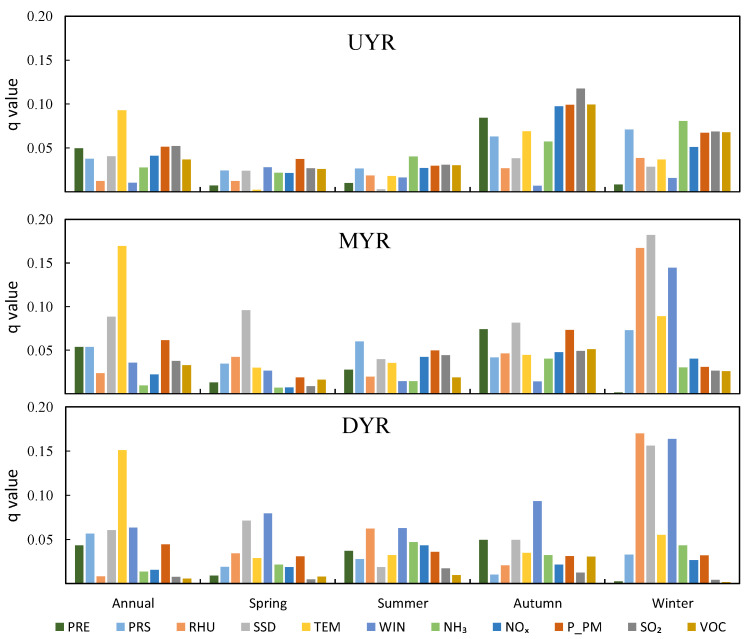
Figure 6.
The inter-annual and inter-season q-values of the driving factors on PM2.5 concentrations in the sub-basin of the Yellow River Basin. (UYR denotes the Upper Yellow River Basin; MYR, denotes the Middle Yellow River Basin; DYR, denotes the downstream area of the Yellow River Basin; PRE denotes accumulated precipitation; PRS denotes surface air pressure; RHU denotes 2-m relative humidity; SSD denotes sunshine duration; TEM denotes air temperature; WIN denotes 10-m wind velocity; NH3 denotes ammonia; NOx denotes nitrogen oxides; P_PM denotes primary PM2.5; SO2 denotes sulfur dioxide; VOC denotes volatile organic compounds).

