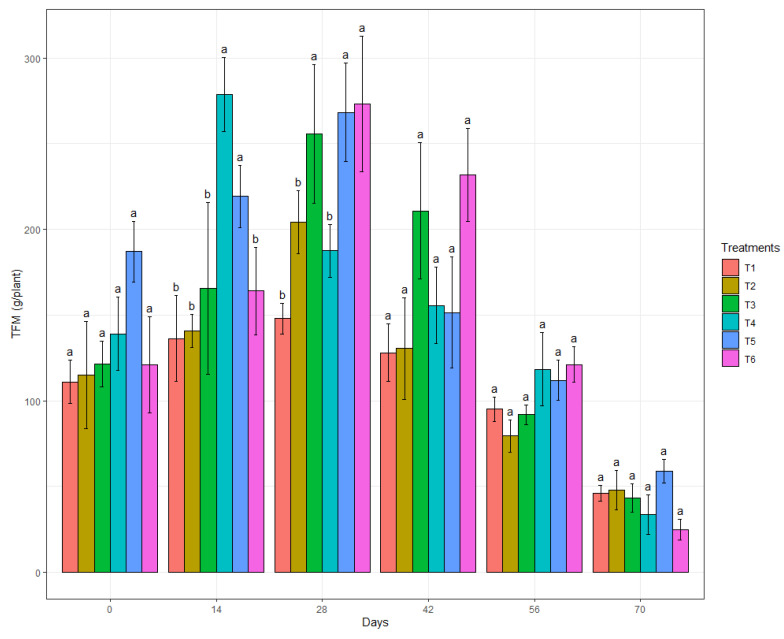
Figure 5.
Mean TFM of the treatments (T1: water; T2: chemical control; T3: biological control; T4: B.BV10 1 g/L; T5: B.BV10 2 g/L; and T6: B.BV10 4 g/L) at each time of evaluation. Means in each day followed by the same letter did not differ significantly from each other by the Scott–Knott test (p < 0.05).

