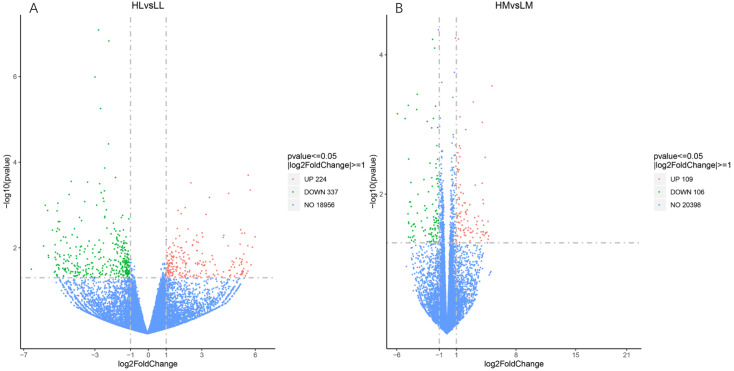
Figure 1.
Volcano plot of the genes differentially expressed between HL vs. LL (A) and HM vs. LM (B) groups. The green dots represent the significantly over-expressed genes in the HL/HM group; the red dots represent the significantly under-expressed genes in HL/HM group; and the blue dots represent the genes whose expression levels did not reach statistical significance.

