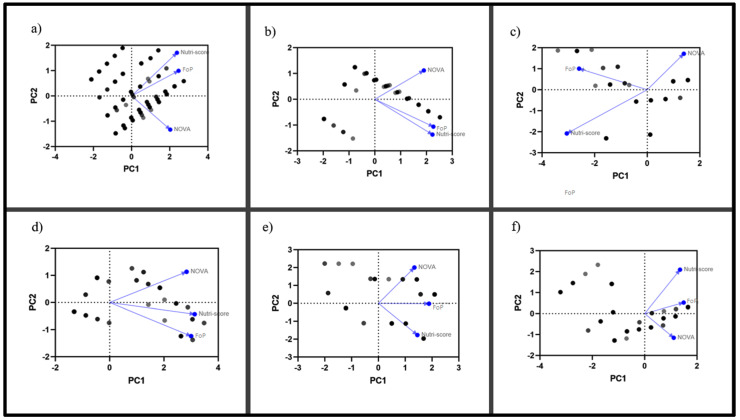
Figure 4.
A Principal Component Analysis of each food system classification. In this figure, we proceeded to qualitatively analyse the systems assessed, identifying the dimensions targeted by a principal component analysis in (a) all foods, (b) cereals, (c) dairy, (d) protein foods, (e) lipids and fats, and (f) sugars and derivatives. This analysis establishes the ranking patterns used by NOVA, Nutri-Score and FoP warning labels, showing the closeness and remoteness between them. Black and grey boxes indicate the spatial location assigned for each input element, and blue arrows indicate the direction and dimension identified for each system.

