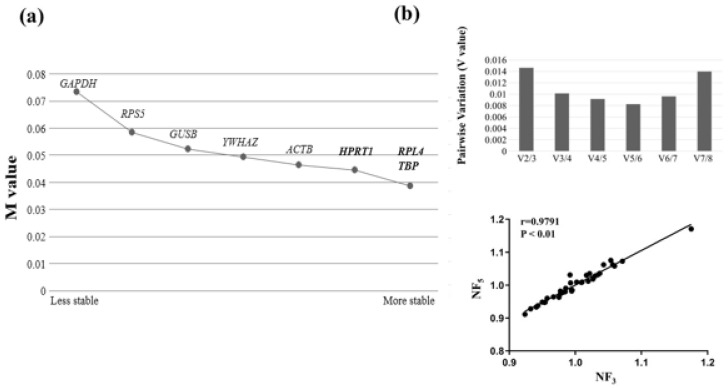
Figure 3.
Assessment for the stability of reference gene used geNorm. (a) The graph presents the ranking of stability of the reference gene. The right side of the graph represents the most stable reference gene, and the left side of the graph represents the most unstable reference gene. The best of three stable reference genes was shown in bold letters. (b) The graph shows the optimal number of reference gene at normalization (NFopt). NFopt was present 5 reference gene (NF5) by pairwise variation (V5/6). Between NF3 and NF5, Pearson’s correlations of normalization factor analyzed by SPSS was suggest high correlation (r = 0.9791, p < 0.01).

