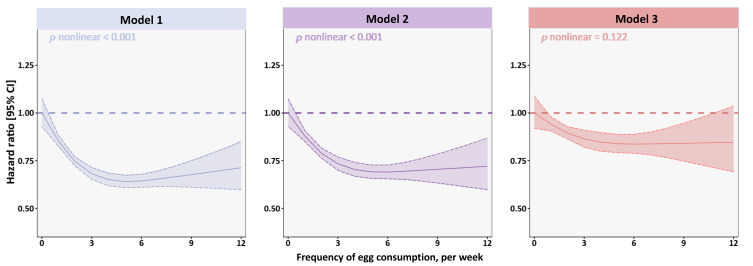
Figure 3.
Restricted-cubic-spline curves detailing egg intake frequency associated with the risk of all-cause mortality. Solid lines represent point estimates of the hazard ratios and dashed lines represented 95% confidence intervals. Model 1: Unadjusted. Model 2: Model 1 + age + gender. Model 3: Model 2 + BMI, ethnicity, residential region, annual household income, physical activity, smoking status, alcohol drinking, chronic disease, meat intake, vegetable intake, fish, dairy products.

