Figure 6.
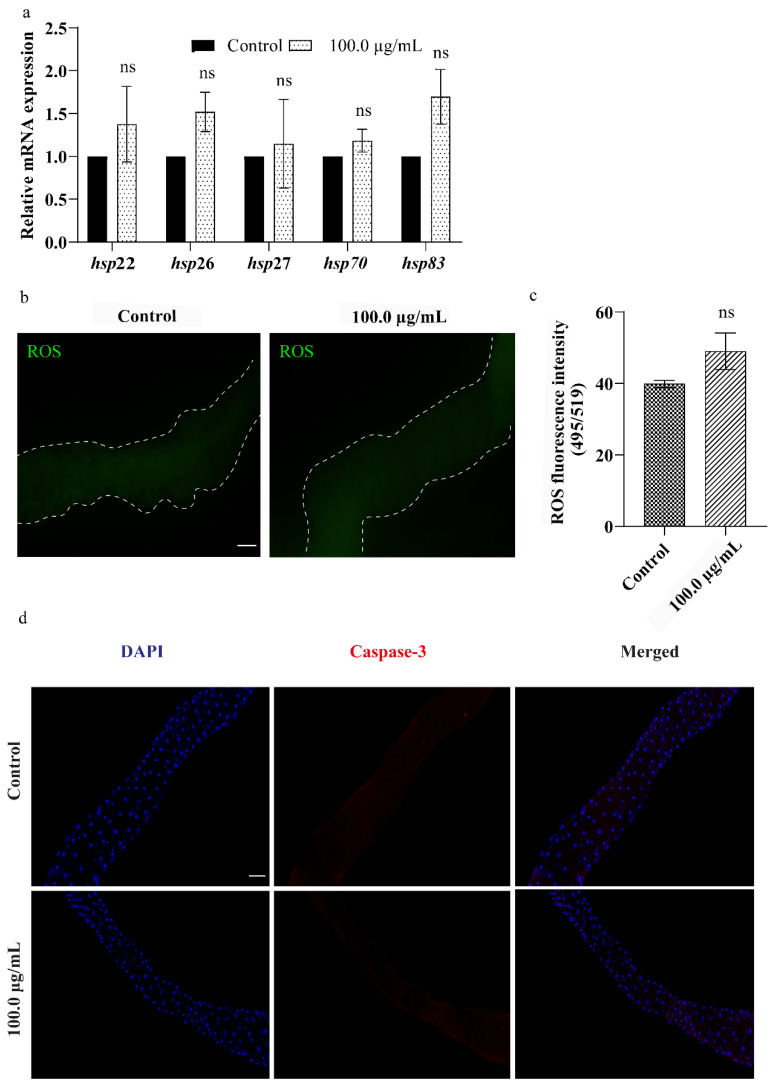
Effect of A.L. extract of C.orchioides at cellular level: (a) hsps expression. The graph represents non-significant hsps expression in the gut of larvae exposed to A.L. extract. (b,c) ROS generation. The graph represents no major change in intensity of DCF fluorescence in control and A.L. extract-treated groups. (d) Apoptotic assay. The graph illustrates no cell death observed in the gut of control larvae and the highest concentration of A.L. extract-fed larval gut (100.0 µg/mL). The gut tissues are stained with DAPI. Significance is ascribed as ns p > 0.05. The scale bar corresponds to 100 µm.

