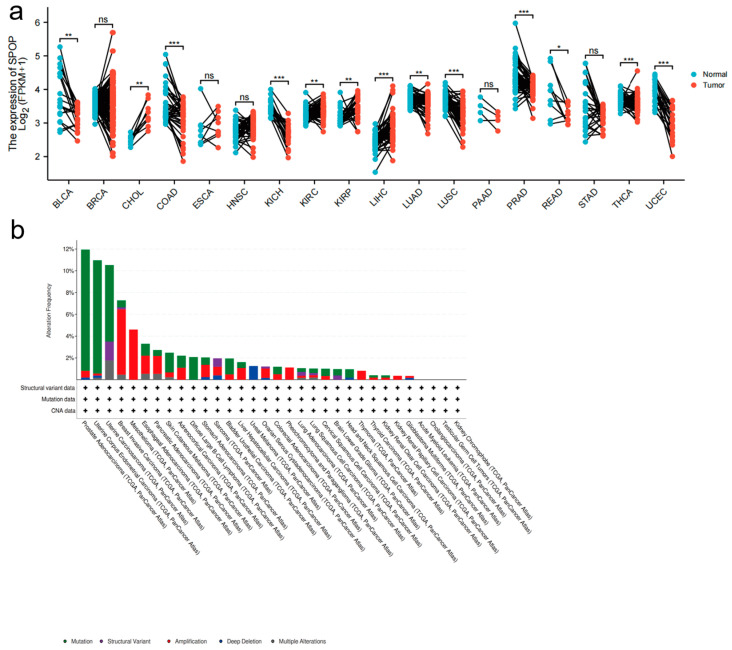
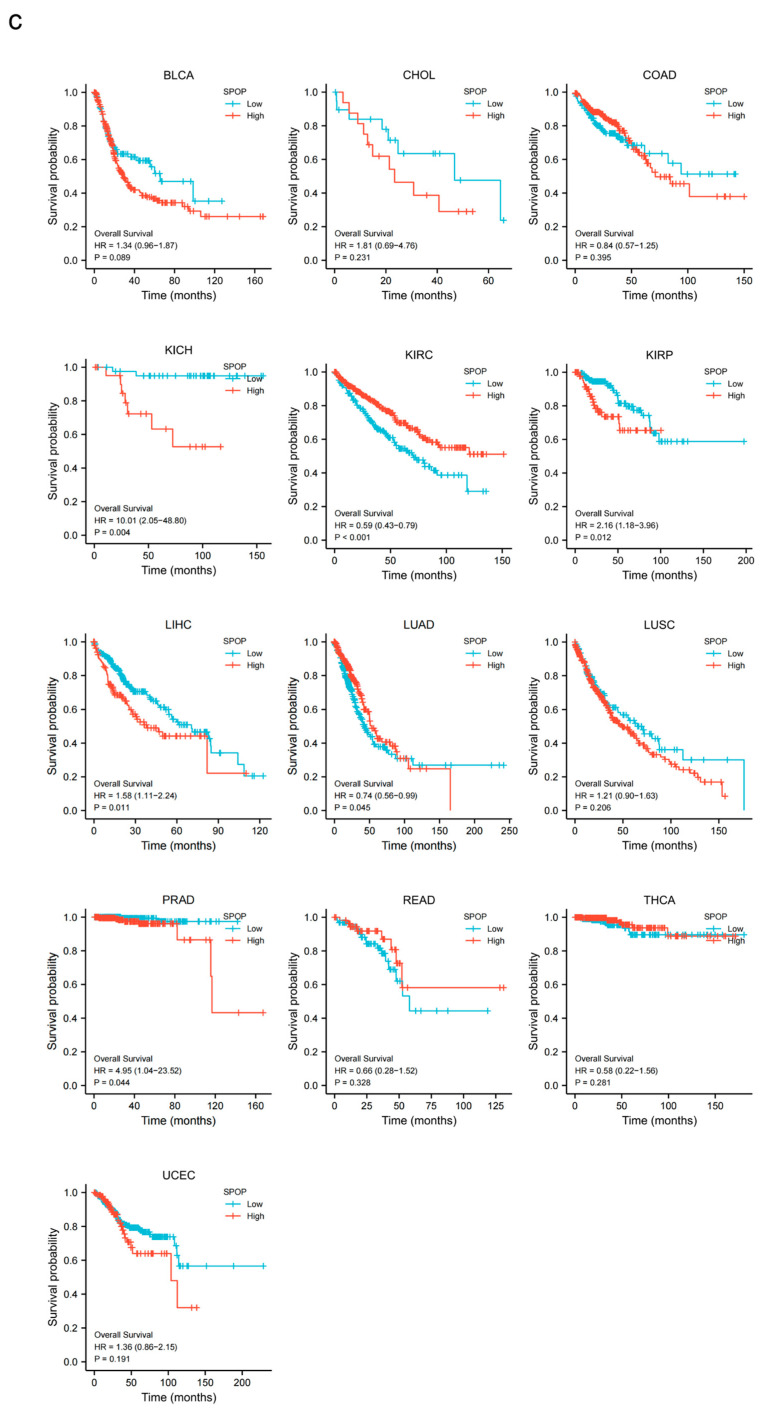
Figure 2.
SPOP mRNA expression in different cancers. (a) A graph showing the levels of SPOP mRNA expression levels in a variety of cancers along with corresponding normal controls; BLCA, Bladder Urothelial Carcinoma; BRCA, Breast invasive carcinoma; CHOL, Cholangiocarcinoma; COAD, Colon Adenocarcinoma; ESCA, esophageal carcinoma; HNSC, Head and Neck squamous cell carcinoma; KICH, Kidney Chromophobe; KIRC, Kidney renal clear cell carcinoma; KIRP, Kidney renal papillary cell carcinoma; LIHC, Liver hepatocellular carcinoma; LUAD, Lung adenocarcinoma; LUSC, Lung squamous cell carcinoma; PAAD, Pancreatic adenocarcinoma; PRAD, Prostate adenocarcinoma; READ, Rectum adenocarcinoma; STAD, Stomach adenocarcinoma; THCA, Thyroid carcinoma; UCEC, Uterine Corpus Endometrial Carcinoma; ns, not significant; * p < 0.05, ** p < 0.01, *** p < 0.001. (b) SPOP alterations occur across multiple cancer types (data from the cBioPortal database). (c) The correlation of SPOP with overall survival is further elevated (data from the The Cancer Genome Atlas (TCGA) portal or other published datasets of clinical cancer samples as indicated).


