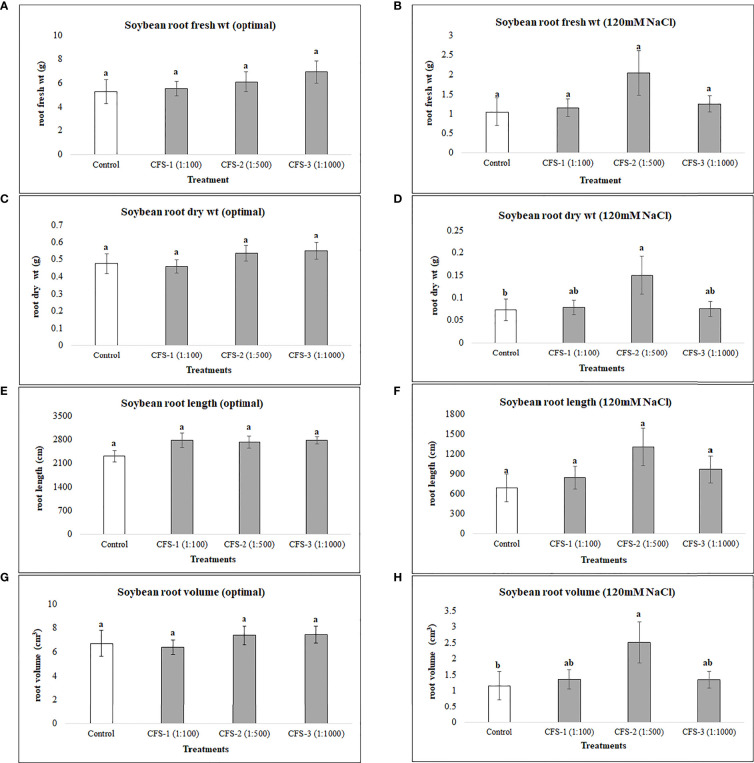
Figure 4.
Soybean root variables affected by CFS (A) root fresh wt - optimal (B) root fresh wt – 120 mM NaCl (C) root dry wt - optimal (D) root dry wt – 120 mM NaCl (E) root length - optimal (F) root length – 120 mM NaCl (G) root volume - optimal (H) root volume – 120 mM NaCl. The data represents the mean values of 8 replications (n=8) ± standard error. Different letters indicate values determined by Tukey’s multiple mean comparison to be significantly different (p< 0.05) from each other.

