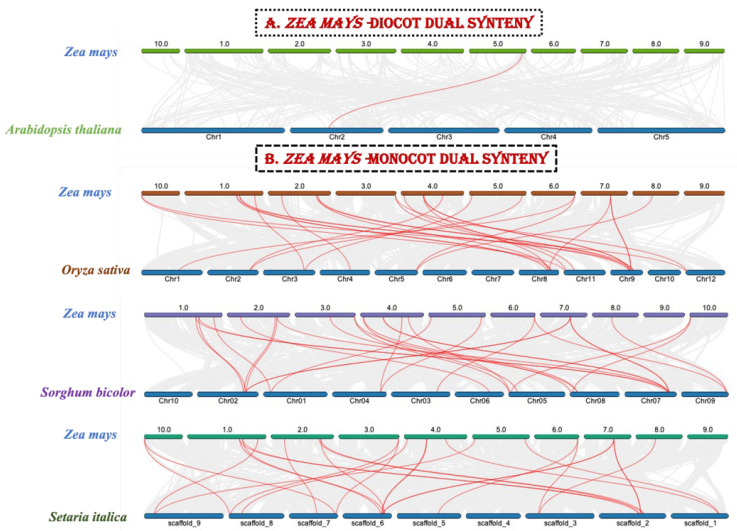
Figure 6.
Synteny analysis of the maize genome with one monocot (A) and three dicot (B) plant genomes. The gray lines represent aligned blocks between the paired genomes, and the red lines indicate syntenic ZHD gene pairs. We performed both dual synteny and specific gene family synteny analyses for the maize genome, this being one of the most important fields in comparative genomic analysis, as it is the basis of evolutionary studies at both the gene and genome levels. We used the species-specific gene family protein sequences, but not in the synteny analysis, as most of the causes have not been properly studied, for instance, the chromosomal gene positions are quite enigmatic. Insofar as we could find well-researched sequences online, we retrieved and dual-synteny-analyzed them. In addition, a specific gene family from the maize genome synteny analysis was studied to comprehend duplication occurrences and internal evolutionary processes.

