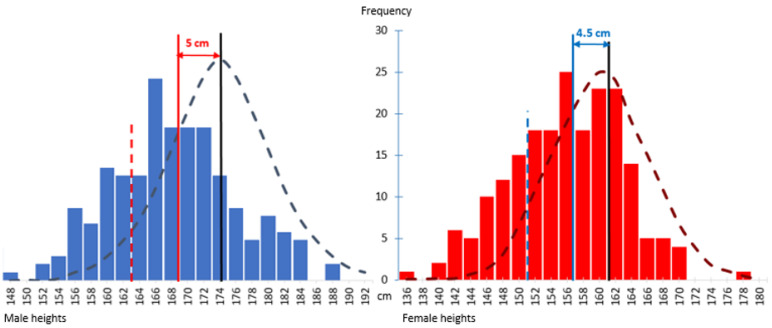
Figure 2.
The histogram on the left (blue bars) shows a normal distribution for adult heights of 192 male 22q11.2DS participants, with a mean (red vertical line) of 169.0 ± 7.8 cm, and on the right the histogram (red bars) similarly shows a normal distribution for adult heights of 205 female 22q11.2DS participants, with mean (blue vertical line) 156.7 ± 7.1 cm. The superimposed male (mean 174.1 ± 7.3 cm) and female (mean 161.2 ± 6.2 cm) Canadian population adult height normal curves for males and females are shown, respectively, by long dashed dark blue and dark red lines. Both historgrams show a leftward shift of approximately 5.0 and 4.5 cm for males and females with 22q11.2DS, respectively. Bars to the left of the dashed red/blue vertical lines indicate those meeting criteria for short stature for males and females, respectively.

