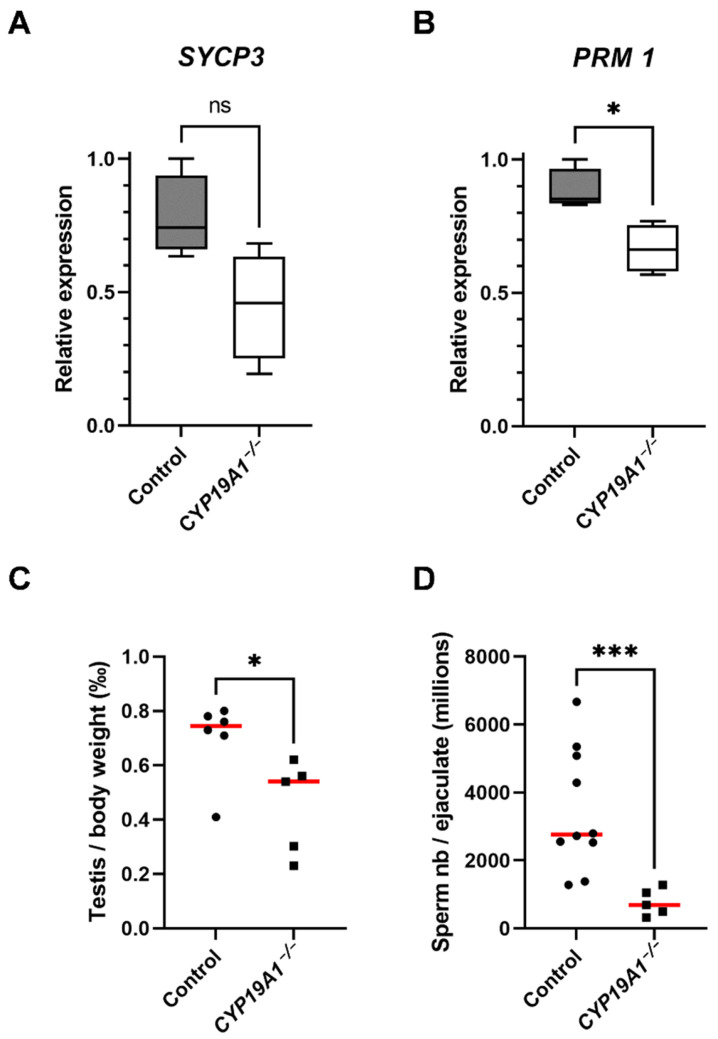
Figure 5.
Hypo-spermatogenesis in CYP19A1−/− males. (A,B) RT-qPCR analyses of mRNA levels of SYCP3 and PRM1 in control and CYP19A1−/− adult testis (n = 5 for each genotype). (C) Testis on body weight ratio in control and CYP19A1−/− rabbits. Control, n = 6; CYP19A1−/− n = 5. The median is shown in red. (D) Total sperm counts per million per ejaculated sample in control and CYP19A1−/− rabbits. Control, n = 10; CYP19A1−/− n = 5. Dots represent the average of two successive semen collections per animal. For CYP19A1−/− rabbits, three sets of two successive ejaculations were collected over a one-year interval. The median is shown in red. Mann–Whitney test: * p-value < 0.05. *** p-Value < 0.0005. ns: non-significant.

