Figure 3.
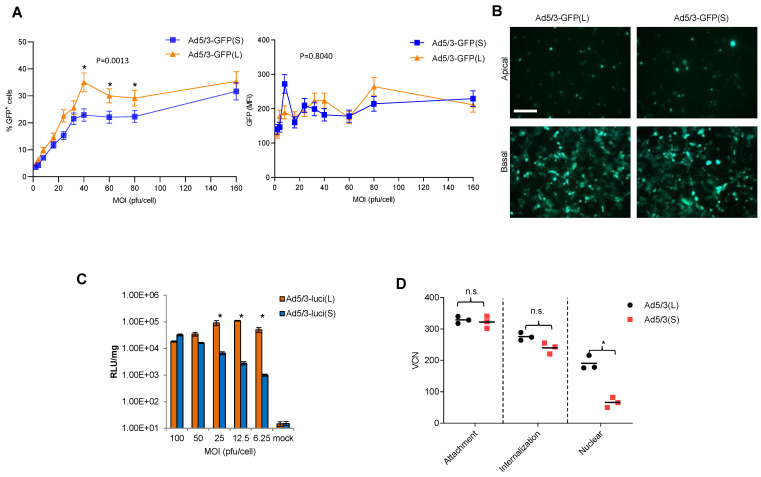
In vitro transduction studies. (A) T84 cells were infected with Ad5/3-GFP viruses at the indicated MOIs. GFP expression was analyzed 20 h after infection by flow cytometry. The left panel shows the percentage of GFP-positive cells; the right panel shows the mean GFP fluorescence intensity (MFI). n = 3. * p < 0.05. (B) To form tight junctions between T84 cells, 2 × 10⁵ T84 cells were plated into polyester membrane transwell inserts and cultured for 21 days with medium change every 3 days. Ad5/3-GFP(S) and Ad5/3-GFP(L) (MOI 200 pfu/cell) were used to infect cells from the apical or basal sides for 1 h. Viruses were then removed, and fresh medium was added. GFP images were taken 48 h post-infection. The scale bar is 20 μm. (C) T84 cells infected with Ad5/3-luc viruses at the indicated MOIs. Luciferase expression was analyzed 20 h after infection and expressed as relative light units (RLU) per mg total protein. n = 3. * p < 0.05. (D) Quantification of viral particles/genomes that were attached, internalized, or transported to the nucleus after infection of HeLa cells with Ad5/3(L) and Ad5/3-GFP(S). Experimental details are shown in Figure S1.

