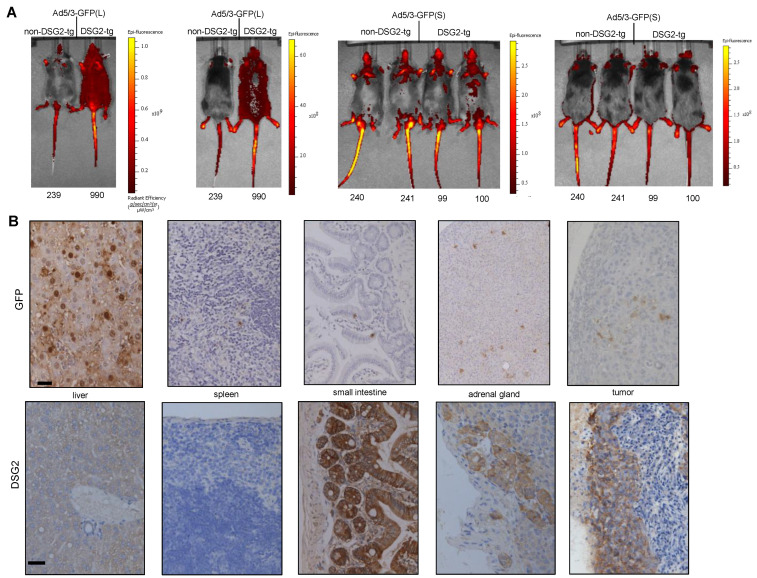
Figure 5.
Biodistribution of GFP expression after intravenous Ad5/3 injection. (A) In vivo GFP imaging. TC1-DSG2+ tumor-bearing non-DSG2 transgenic mice (litter mates) and DSG2-transgenic mice were intravenously injected via the tail with pfu of Ad5/3-GFP(L) or Ad5/3-GFP(S). Mice were subjected to imaging 3 days later. Shown are two mice injected with Ad5/3-GFP(L) and four mice injected with Ad5/3-GFP(S) from the font and the back. The color reflects the radian efficiency, the range of which is indicated in the bars to the right of the images. The tag numbers are indicated below the images. (B) GFP and DSG2 immunohistochemistry analyses of selected organs and the tumor harvested on day 3 after Ad5/3-GFP (L) injection. GFP staining appears brown. The scale bar is 20 μm. Shown are representative sections of mouse #990. DSG2 staining of tumor sections is shown in Figure 4A.

