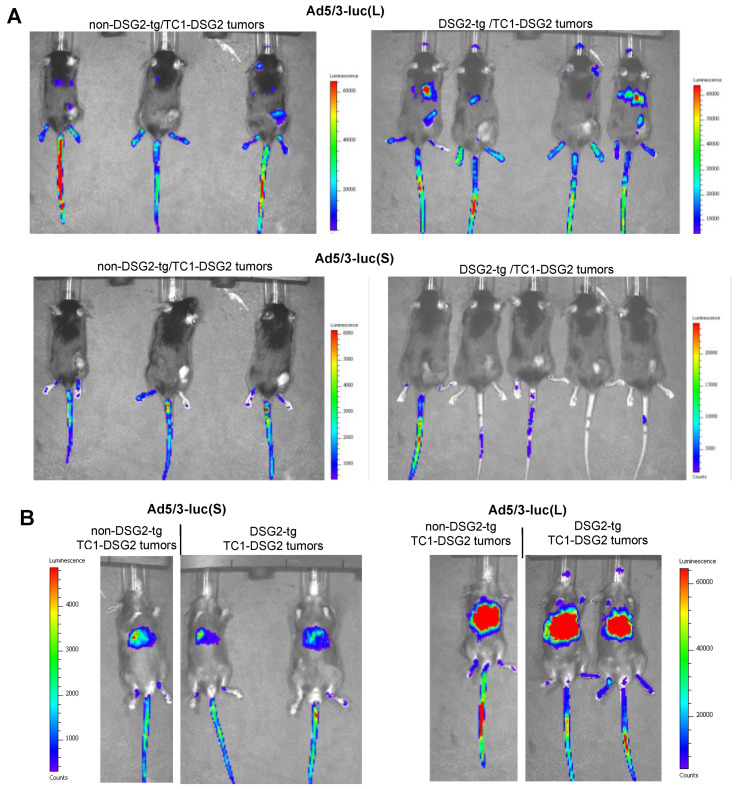
Figure 6.
In vivo imaging for luciferase expression after intravenous Ad5/3 injection. (A) Images taken from the back of mice on day 3 after virus injection. Shown are three non-DSG2-tg/TC1-DSG2 tumors and four DSG2-tg/TC1-DSG2 tumor mice injected with Ad5/3-luc(L) or Ad5/3-luc(S). Tumors are visible at the lower right back side. Strong signals at the injection site (tail veins) are noted. The exposure time was 180 s. (B) Images taken from the front of mice.

