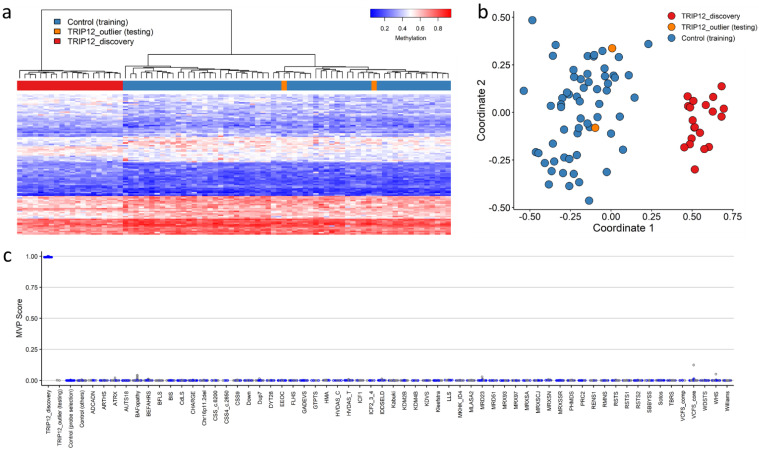
Figure 3.
Clark–Baraitser syndrome (TRIP12) episignature—discovery cohort: (a) Euclidean hierarchical clustering (heatmap): each column represents a single TRIP12 discovery case or control; each row represents 1 of the 105 CpG probes selected for the episignature. This heatmap shows clear separation between 20 TRIP12 cases (red) from controls (blue). Two outlier cases (orange) are shown to segregate with controls; (b) Multidimensional scaling (MDS) plot shows segregation of TRIP12 cases from both controls and outlier cases; (c) Support Vector Machine (SVM) classifier model. The model was trained using the 105 selected TRIP12 episignature probes, 75% of controls and 75% of other neurodevelopmental disorder samples (blue). The remaining 25% controls and 25% of other disorder samples were used for testing (grey). Plot shows the TRIP12 discovery cases with a methylation variant pathogenicity (MVP) score close to 1 compared with all other samples, showing the specificity of the classifier and episignature.

