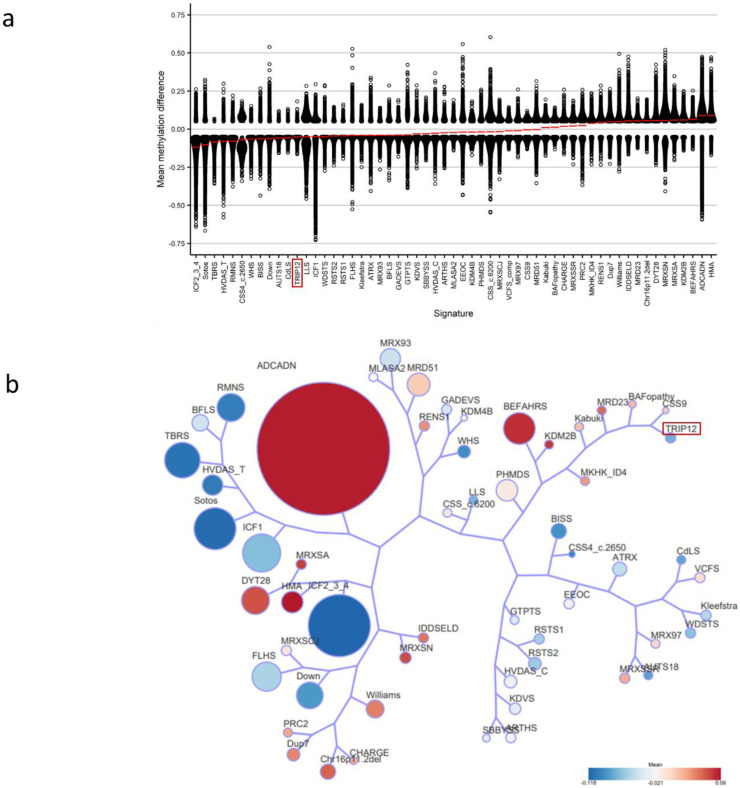
Figure 8.
Relationships between the TRIP12 cohort and 56 other EpiSign™ disorders: (a) Methylation differences of all differentially methylated probes (DMPs) for each cohort, sorted by mean methylation. Each circle represents one probe. Red lines indicate mean methylation; (b) Tree and leaf visualization of Euclidean clustering of all 57 cohorts using the top n DMPs for each group, where n = min (# of DMPs, 500). Cohort samples were aggregated using the median value of each probe within a group. A leaf node represents a cohort, with node sizes illustrating relative scales of the number of selected DMPs for the corresponding cohort, and node colors are indicative of the global mean methylation difference. Abbreviations are listed in Supplementary Table S3.

