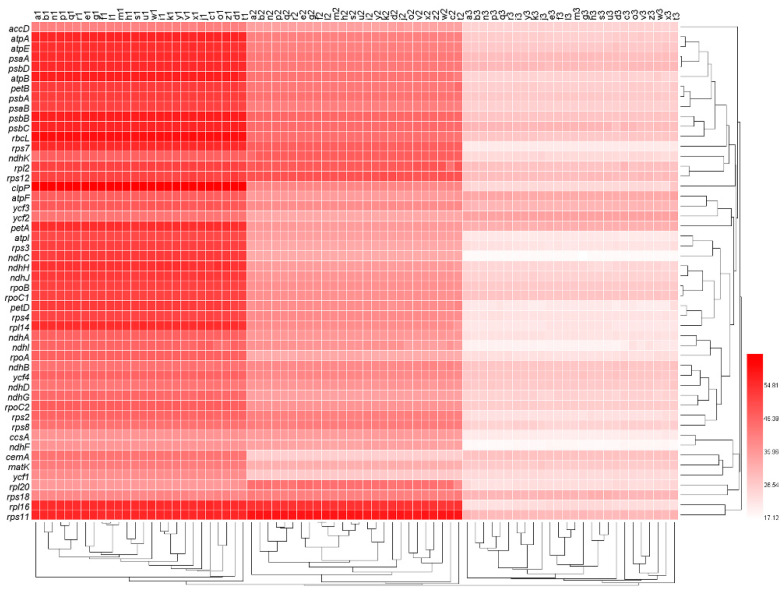
Figure 1.
The nucleotide composition at the first, second, and third codon positions of all genes. The numbers next to the legend indicate the percentage of GC content. Lowercase letters from a to z at the top of the heat map represent the data sets of oak trees Q. rubra, Q. aliena, Q. spinose, Q. aquifolioides, Q. baronii, Q. variabilis, Q. dolicholepis, Q. tarokoensis, Q. glauca, Q. tungmaiensis, Q. sichourensis, Q. chenii, Q. acutissima, Q. dentate, Q. obovatifolia, Q. wutaishanica, Q. mongolica, Q. robur, Q. bawanglingensis, Q. coccinea, Q. phillyraeoides, Q. gilva, Q. pannosa, Q. virginiana, Q. acuta, and Q. chungii, respectively. The numbers 1, 2, and 3 after the lowercase letters represent the 1st, 2nd, and 3rd positions of the synonymous codons, respectively.

