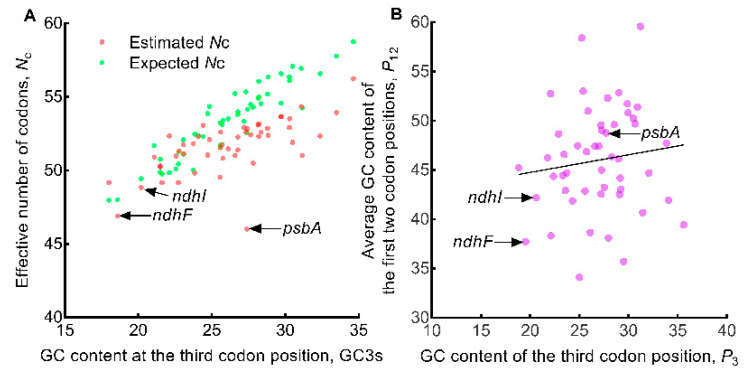
Figure 6.
Exploring the influencing factors of codon usage in oak chloroplast genome. The solid color circles represent the 50 genes. (A) Estimated Nc (effective number of codons) versus expected Nc plot analysis. (B) P12 versus P3 plot analysis. The solid line represents the regression of P12 (average of P1 and P2) against P3, equation y = 0.1791x + 41.17, R2 = 0.0155, p = 0.389.

