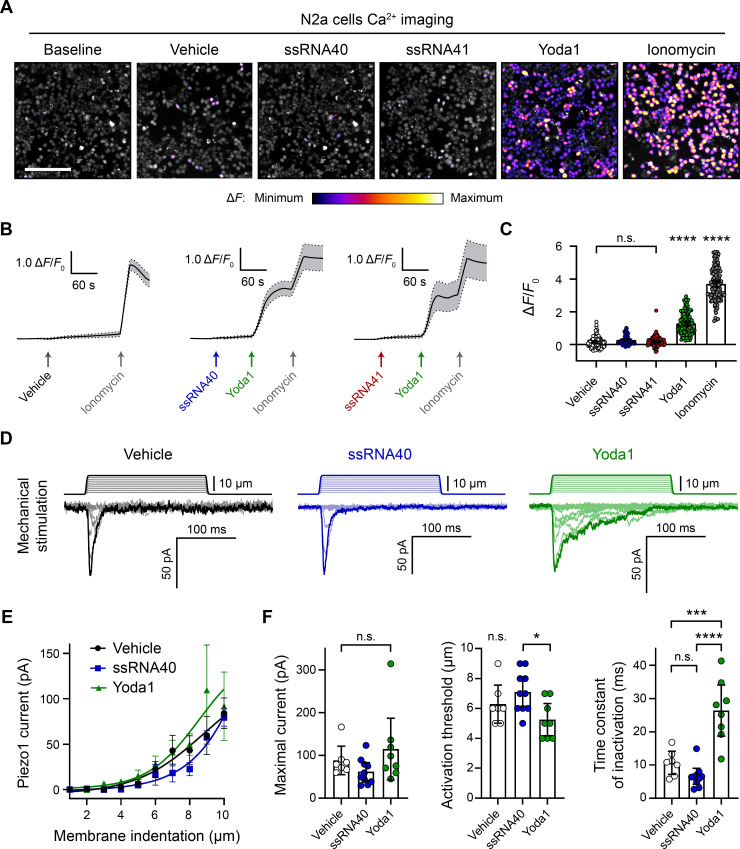
Figure 1. ssRNA40 does not alter calcium activity or mechanotransduction in N2a cells.
(A) Fluo-4 calcium imaging of N2a cells during exposure to different treatments, representative of ≥3 independent recordings for each condition. The magnitude of the change in fluorescence (ΔF) is represented on a fire color scale and is superimposed on a grayscale baseline fluorescence image. Cells were exposed to buffer only (vehicle) or 10 µg/mL ssRNA40 or ssRNA41 for up to 3 min, followed by 30 µM Yoda1 and 10 µM ionomycin. Scale bar is 200 µm. (B) Example calcium imaging traces of vehicle, ssRNA40, or ssRNA41, as well as Yoda1 and ionomycin control treatments. Fluorescence values are shown as ΔF normalized to the initial fluorescence (ΔF/F0). n = 50 cells plotted as mean ± 95% CI. (C) Quantification of calcium responses to different treatments. n = 50 cells per condition. Error bars indicate mean ± 95% CI. One-way ANOVA with Bonferroni correction: not significant (n.s.) p≥0.05, **** p<0.0001. (D) Example whole-cell voltage-clamp recordings of N2a cells during mechanical stimulation. Top traces indicate the magnitude of plasma membrane indentation in 1 µm steps, and bottom traces show whole-cell currents elicited by the stimuli. Vehicle, 10 µg/mL ssRNA40, or 30 µM Yoda1 were bath-applied 10 min prior to recording. (E) Piezo1 current versus membrane indentation to illustrate stimulus–response relationships. n = 7–10 cells per condition are plotted to show the mean current per level of indentation, with error bars indicating the standard error of the mean (SEM). (F) Quantification of mechanically evoked current amplitude, threshold, and inactivation. n = 7–10 cells per condition. Error bars represent mean ± 95% CI. One-way ANOVA with Bonferroni correction: n.s. p≥0.05, *p<0.05, ***p<0.001, ****p<0.0001.

