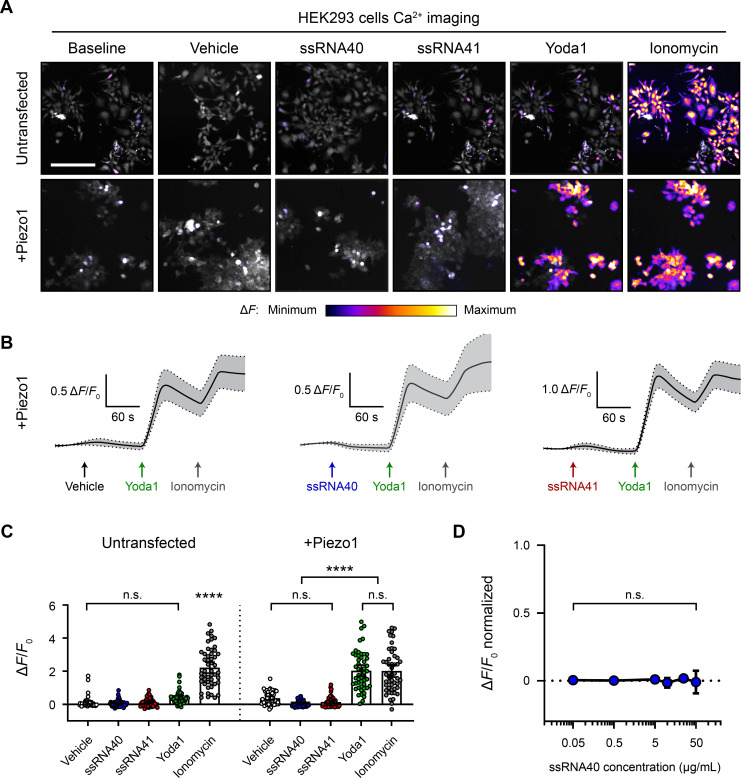
Figure 2. ssRNA40 does not activate Piezo1-transfected HEK293 cells.
(A) Fluo-4 calcium imaging of HEK293 cells, with or without transfection of mouse Piezo1, representative of ≥3 independent recordings for each condition. Treatment concentrations are 10 µg/mL ssRNA40 or ssRNA41, 30 µM Yoda1, and 10 µM ionomycin. Scale bar is 200 µm. (B) Example calcium imaging traces of Piezo1-transfected HEK293 cells during different treatments. Yoda1 was applied 90 s after any given RNA sample, and only cells that responded to Yoda1 (presumably Piezo1-transfected) were analyzed. Transfection efficiency was generally >60% of the cell culture. n = 50 cells plotted as mean ± 95% CI. (C) Quantification of HEK293 cell calcium responses. n = 50 cells per condition plotted as mean ± 95% CI. One-way ANOVA with Bonferroni correction: n.s. p≥0.05, ****p<0.0001. (D) Dose–response curve of ssRNA40 treatment on Piezo1-transfected GCaMP6s-expressing HEK293 cells. After 1 min of baseline measurement, ssRNA40 was administered for 3 min followed by ionomycin for 1 min. A random selection of cells was analyzed from each recording. The responses are normalized, with the ionomycin response being ΔF/F0 = 1. n = 25 cells per dose plotted as mean ± 95% CI. One-way ANOVA with Bonferroni correction: n.s. p≥0.05.


