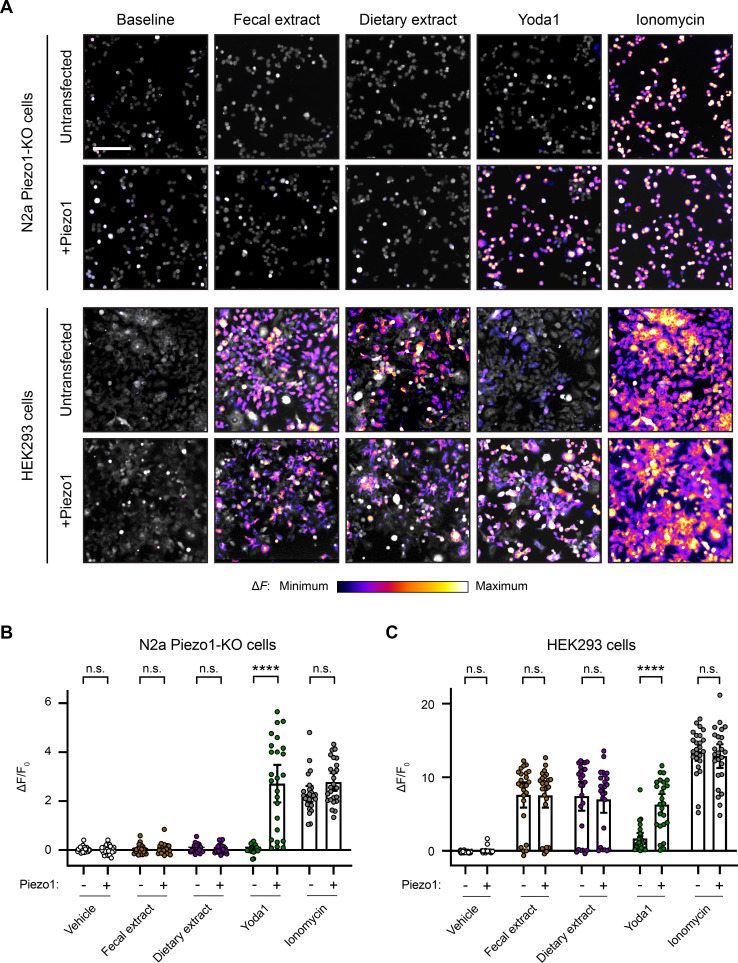
Figure 5. Fecal and dietary extracts induce cell line-specific activity independently of Piezo1.
(A) Calcium imaging of N2a Piezo1-KO cells and HEK293 cells, with or without Piezo1 transfection, representative of ≥2 independent recordings for each condition. Fluo-4 or GCaMP6s were used to image the N2a cells or HEK293 cells, respectively. Treatment concentrations are 5 mg/mL fecal or dietary extract, 30 µM Yoda1, or 10 µM ionomycin. Scale bar is 200 µm. (B) Quantification of calcium responses. n = 25 cells per condition plotted as mean ± 95% CI. Pairwise comparisons between untransfected and transfected recordings using Kruskal–Wallis with Dunn’s multiple-comparisons test: n.s. p≥0.05, **** p<0.0001.

